Saturday, November 18, 2017

WEEKLY MARKET OUTLOOK FOR NOV 20 THRU NOV 24, 2017

WEEKLY MARKET OUTLOOK FOR NOV 20 THRU NOV 24, 2017
In the week that has gone by, the benchmark NIFTY50 has 
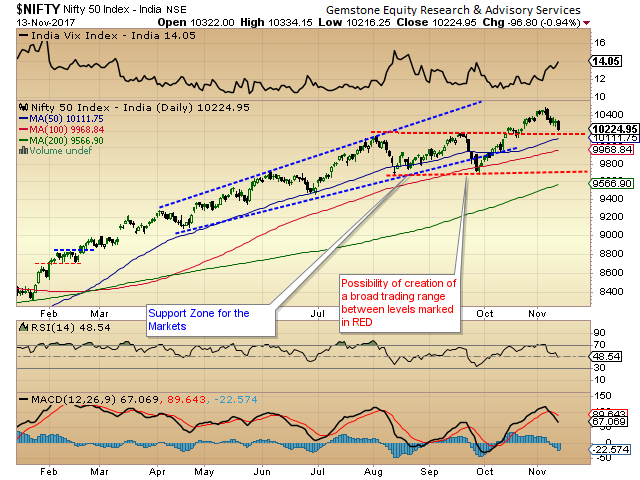
ended with net loss of 38.15 points or 0.37% on weekly basis. In our previous weekly note, we had expected consolidation and a worst case support in the 10180-10200 zones. However, the NIFTY went slightly below this forming the low at 10094. In the coming week, this Week’s high of 10343 will pose serious resistance followed by the 10490 mark. On the Weekly Charts, there is Classical Bearish Divergence on the RSI. There is ample evidence present on the weekly Charts that despite defined up moves, we may not see the  Markets scaling fresh highs so fast and easily once gain.

The levels of 10345 and 10490 will act as major resistance levels for the coming week. Supports come in at 10100 and 9930 zones.

The Relative Strength Index – RSI on the Weekly Chart is 63.8336 at it remains neutral against the price. The Weekly MACD is still bullish and trades above its signal line but is rapidly narrowing its trajectory. On the Candles, a classical Hanging Man emerged. When this happens after a serious up move, it often signals a top or a minor reversal.

If we do a detailed pattern analysis, since 10,100 levels until the NIFTY marked its high at 10490, the Weekly RSI has consistently marked a lower top and has persistently shown a Negative Divergence. Also, this is coupled with a Classical topping formation on the Weekly Candles as well. All this points towards the fact that the run-up for the Markets to 10490 and beyond will not be easy. We may once again see the Markets forced into some consolidation and corrective pressure at higher levels. At the same time, we also do not see the signs of the primary bull trend being fractured. We advice to continue making stock specific purchases with declines and as effectively rotating sectors will be important. Caution is advised as until 10490 is breached on the upside, it has become a intermediate top for the Markets.

A study of Relative Rotation Graphs – RRG show that the METAL, ENERGY and along with Services Sector is continuing to lose Momentum and may show some weakness in relative performance. However, METAL may see very select out-performance but the Index per-se may continue to lose momentum. We can see relative out-performance coming from IT, MEDIA, PHARMA and Public Sector Enterprises. The FMCG may continue to attempt to consolidate its performance vis-à-vis general Markets.

Important Note: RRG™ charts show you the relative strength and momentum for a group of stocks. In the above Chart, they show relative performance as against NIFTY Index and should not be used directly as buy or sell signals.

(Milan Vaishnav, CMT, MSTA is Consultant Technical Analyst at Gemstone Equity Research & Advisory Services, Vadodara. He can be reached at milan.vaishnav@equityresearch.asia

Milan Vaishnav, CMT, MSTA
Technical Analyst
(Research Analyst, SEBI Reg. No. INH000003341)
Member
CMT Association (Formerly Market Technicians Association, (MTA), USA
Canadian Society of Technical Analysts, (CSTA), CANADA
Society of Technical Analysts, STA (UK)


+91-70164-32277  /  +91-98250-16331 


Friday, November 17, 2017

MARKET OUTLOOK FOR FRIDAY, NOV 17, 2017

MARKET OUTLOOK FOR FRIDAY, NOV 17, 2017
After more than a week of continuous downsides, the Indian Equities saw a huge spate of short covering as the benchmark NIFTY50 ended the day with decent gains of 96.70 points or 0.96%. Two important things happened on Thursday’s session. First, the Markets validated once again the support levels of 50-DMA, and second; it crawled back above the 10180-10200 zones once again further validating those support levels. Going into trade on Friday, we expect this pullback to continue at least in the initial trade. It would be extremely important to see that the short covering that we saw in the previous session gets replaced with fresh buying. This would be essential for the Markets to build up on this technical pullback.
The levels of 10245 and 10280 will act as immediate resistance levels for the Markets. Supports come in at 10180 and 10125 zones.

The Relative Strength Index – RSI on the Daily Chart is 48.9354 and it remains neutral showing no divergence against the price. The Daily MACD is still bearish as it trades below its signal line. No significant formations are seen on Candles.

The pattern confirms the level of 50-DMA as valid support at Close levels. The levels of 10180-10200 are now once again expected to continue to extend its support if the Market chooses to consolidate once again.

All in all, we expect this pullback to continue at least in the initial trade. As mentioned earlier, it would be important that the short covering that was seen in the previous session gets replaced with fresh buying. If this happens, we will see this technical pullback sustaining. We need to approach the Markets with caution and at the same time, continue to utilize any corrective moves once again to make select purchases. The undercurrent of the Markets which is buoyant remains intact so long as the Markets are able to defend the 50-DMA at Close levels. A cautiously positive outlook is advised for the day.

Milan Vaishnav, CMT, MSTA
Technical Analyst 
(Research Analyst, SEBI Reg. No. INH000003341)


Member: 
CMT Association (Formerly known as Market Technicians Association, (MTA), USA
Canadian Society of Technical Analysts, (CSTA), CANADA
Society of Technical Analysts (STA), UK  


+91- 70164-32277  /  +91-98250-16331  

Thursday, November 16, 2017

MARKET OUTLOOK FOR THURSDAY, NOV 16, 2017

MARKET OUTLOOK FOR THURSDAY, NOV 16, 2017
The Indian Equity Markets extended its corrective spell and continued to end in the red on Wednesday as well as the benchmark NIFTY50 closed losing 68.55 points or 0.67%. Though we did see some modest recovery in the end but the Index still closed below the 10180-10200 support area. The NIFTY has taken support at its 50-DMA which stand at 10120 and this levels remains a crucial level to watch for at Close levels. Going into trade on Thursday, we can expect a modest start to the trading day but all throughout, it would be extremely crucial for the NIFTY to crawl back above the 50-DMA and reach back towards 10180-10200 which will now act as modest resistance for the Markets.

The levels of 10180 and 10235 will play out as immediate resistance for the Markets if we see a technical pullback. The support now comes at 9979-9980 which is the 100-DMA of the NIFTY.

The Relative Strength Index – RSI on the Daily Chart is 40.8425 and it has continued to mark its 14-period low which is Bearish. No divergence against the price is seen. Daily MACD continues to remain bearish while trading below its signal line. On the Candles, a falling window occurred. This usually implies continuation of weak trend for some more time.

The pattern analysis shows that the NIFTY broke out from the 10180-10200 zones and after that it has not only suffered a 100% throwback, it has dipped inside these levels of 10180-10200 which were otherwise expected to act as its support.

The Markets now currently rests at its 50-DMA and there are chances that it makes feeble attempt to recover and see some pullback. However, the attempts might remain feeble and the corrective pressure may remain evident. The levels of 50-DMA would be crucial support for the Markets at Close levels and failing which we will see possibilities of the NIFTY testing its 100-DMA which is currently at 9979. All in all, we still continue to recommend making extremely select purchases using the corrective pressures. Markets are expected to continue to see isolated stock specific out-performances. Cautious approach is advised for the day.

Milan Vaishnav, CMT, MSTA
Technical Analyst 
(Research Analyst, SEBI Reg. No. INH000003341)


Member: 
CMT Association (Formerly known as Market Technicians Association, (MTA), USA
Canadian Society of Technical Analysts, (CSTA), CANADA
Society of Technical Analysts (STA), UK  


+91- 70164-32277  /  +91-98250-16331  

Wednesday, November 15, 2017

MARKET OUTLOOK FOR WEDNESDAY, NOV 15, 2017

MARKET OUTLOOK FOR WEDNESDAY, NOV 15, 2017
The Markets ended in red for the second day in a row on Tuesday as the last hour of the trade saw the benchmark NIFTY50 paring all of its intraday recovery. The Index ended the day with a net loss of 38.35 points or 0.38%. Going into trade on Wednesday,  the Markets remain in extremely precarious condition and the levels of 10180-10200 remain extremely critical levels to watch out for. When the Markets traded in a rectangle formation for nearly 3 months, these levels of 10180-10200 acted as a resistance. Now on its way down, these supports are strongly expected to act as supports.

The levels of 10245 and 10270 are expected to act as immediate resistance levels for the Markets.  Immediate support for the Markets exists at 10115 which is the 50-DMA level.

The Relative Strength Index – RSI on the Daily Chart is 45.5995 and it has marked a fresh 14-period low which is bearish. However, it does not show any divergence against the price. The Daily MACD stays bearish while trading below its signal line.

The pattern analysis confirms that the NIFTY has achieved a 100% throwback. This means that it has retraced 100% of its up move when it had broken out from 10200 levels. It now trades at those very levels from where it broke out.

Theoretically speaking, the zones of 10180-10200 were serious resistance levels for the Markets when it broke out from there. On its way back, these levels are strongly expected to act as supports. We expect a tepid start to the Markets going into trade on Wednesday. It would be important to note that any significant breach from 10180-10200 zones would increase the possibilities of the Markets testing its 50-DMA level. While adopting highly cautious view on the Markets, we also expect to see isolated stock specific out-performances as well.

Milan Vaishnav, CMT, MSTA
Technical Analyst 
(Research Analyst, SEBI Reg. No. INH000003341)


Member: 
CMT Association (Formerly known as Market Technicians Association, (MTA), USA
Canadian Society of Technical Analysts, (CSTA), CANADA
Society of Technical Analysts (STA), UK  


+91- 70164-32277  /  +91-98250-16331  

Tuesday, November 14, 2017

MARKET OUTLOOK FOR TUESDAY, NOV 14, 2017

MARKET OUTLOOK FOR TUESDAY, NOV 14, 2017
The Indian Equity Markets had a weak start to the trading week as the benchmark NIFTY50 ended the day losing 96.80 points or 0.94%. The first half of the session on Monday remained weak and the second half even weaker as the Index rapidly lost ground. With the current Close levels of 10224.95, the Index has given up nearly 90% of the gains it achieved after breaking out from 10200 levels. Going into trade on Tuesday, the levels of 10200 would be critical to watch out for. It would be extremely necessary for the Markets to take support around 10180-10200 zones. This was the major resistance level that the NIFTY had cleared and during this corrective phase, these levels are supposed to act as major support.
The levels of 10290 and 10325 will play out as important resistance levels in event of an up move. The supports come in at 10180 and 10110 zones.

The Relative Strength Index – RSI on the Daily Chart is 48.5363 and it has reached its lowest value in last 14-period which is bearish. RSI does not show any divergence against the price. The Daily MACD is bearish as it is trading below its signal line. An Engulfing Bearish Pattern has emerged. It has emerged after a significant decline and therefore it can mark a reversal.

The pattern analysis shows that the after several weeks of remaining in a trading range in a rectangle formation, the NIFTY achieved a upward breakout from 10200 levels. However, with the Monday’s decline, it has given back nearly 90% of its gains and has suffered a near 100% throwback.

All in all, it is beyond doubt that the level of 10200 would remain a very important level to watch for. The Market is strongly expected to take support at the 10180-10200 zones and attempt a pullback. Any dip below this may see the Markets testing its 50-DMA. However, given the amount of shorts in the system and indicated by some lead indicators, this may be unlikely and the Markets may attempt a technical pullback. Any significant dip below 10200 would warrant an attention and until this happens, we can continue to utilize all the downsides in making stock specific purchases.

Milan Vaishnav, CMT, MSTA
Technical Analyst 
(Research Analyst, SEBI Reg. No. INH000003341)


Member: 
CMT Association (Formerly known as Market Technicians Association, (MTA), USA
Canadian Society of Technical Analysts, (CSTA), CANADA
Society of Technical Analysts (STA), UK  


+91- 70164-32277  /  +91-98250-16331  

Monday, November 13, 2017

MARKET OUTLOOK FOR MONDAY, NOV 13, 2017

MARKET OUTLOOK FOR MONDAY, NOV 13, 2017
In a volatile session on Friday, the benchmark NIFTY50 ended the day with a modest gain of 12.80 points or 0.12%.  The final hour of the trade saw the Index recovering nearly 75-odd points from the lows of the day. With the given technical structure, we can sure this label such behavior of the Markets as display of internal strength. Notwithstanding the fact that the Markets in general still continue to remain prone to some more consolidation, we can expect the Markets to trade with positive bias on Monday. The levels of 10200 will continue to provide important support in event of any downsides.

The levels of 10350 and 10390 will remain important resistance levels. Supports come in at 10275 and 10200 levels.

The Relative Strength Index – RSI on the Daily Chart is 57.1654. It remains neutral showing no divergence against the price.  The Daily MACD stays bearish trading below its signal line. No significant formations were seen on Candles.

While the pattern analysis continue to show the Markets taking a breather after breaking out from 10200 zones, the current levels represent nearly 60% retracement from its  recent highs. Also, the last hour recovery on Friday has come with a very decent addition of Open Interest. All this point towards the underlying strength that the Markets have been demonstrating in general. It is very likely that the downsides, if any, will remain limited and all such corrective moves that result into consolidation should be utilized to make stock specific purchases.

Milan Vaishnav, CMT, MSTA
Technical Analyst 
(Research Analyst, SEBI Reg. No. INH000003341)


Member: 
CMT Association (Formerly known as Market Technicians Association, (MTA), USA
Canadian Society of Technical Analysts, (CSTA), CANADA
Society of Technical Analysts (STA), UK  


+91- 70164-32277  /  +91-98250-16331  

Sunday, November 12, 2017

WEEKLY MARKET OUTLOOK FOR NOV 13 THRU NOV 17, 2017

WEEKLY MARKET OUTLOOK FOR NOV 13 THRU NOV 17, 2017
Very much on analyzed lines on our previous Weekly Note, the meaningful up move in the benchmark NIFTY50 continued to elude us while the Index marked marginal highs. In the week that has gone by, the NIFTY has settled with net weekly loss of 130.75 points or 1.25%. The high of the Week which was 10490.45 resisted precisely to the 22-month long upper trend line of the rising channel that the NIFTY have formed. In the coming week, we will see the Markets positively consolidating. In the worst case scenario, the levels of 10200 are expected to act as sacrosanct support. In all likelihood, we will see the Markets positively consolidating and attempting some up moves. However, the levels of 10490 will act as immediate serious resistance levels over coming days.

The important levels on the upside to watch for would be 10450 and 10525. The supports should come around 10200-10150 zones.

The Relative Strength Index – RSI on the Weekly Chart is 65.4097. It remains neutral showing no divergences against the price. The Weekly MACD is bullish while it trades above its signal line. No significant formations on Weekly Candles were observed.

It is evident on the Charts that the Markets have resisted to the 22-month long upper trend line of the rising channel. The levels have acted as a pattern resistance but given the rising nature of the trend line, the NIFTY will have ability to continue to give marginal highs. With the levels of 10200-10150 zones acting as strong support in event of downsides, we will see the Markets consolidating with a strong positive bias in the coming week.

A study of Relative Rotation Graphs – RRG show that the METAL pack is steadily losing momentum on the Charts. We may see individual gains but overall no meaningful up move can be expected in metals. FMCG is seen consolidating its performance and is expected to relatively perform better. Strong momentum is seen in PHARMA and MIDCAP universe. REALTY and Small Cap universe may also attempt to relatively outperform the Markets. ENERGY and Service sector too is seen losing momentum and no significant performance can be expected from these sectors.. Some outperformance can also be expected from AUTO and INFRA stocks.

Important Note: RRG™ charts show you the relative strength and momentum for a group of stocks. In the above Chart, they show relative performance as against NIFTY Index and should not be used directly as buy or sell signals.

(Milan Vaishnav, CMT, MSTA is Consultant Technical Analyst at Gemstone Equity Research & Advisory Services, Vadodara. He can be reached at milan.vaishnav@equityresearch.asia

Milan Vaishnav, CMT, MSTA
Technical Analyst
(Research Analyst, SEBI Reg. No. INH000003341)
Member

CMT Association (Formerly Market Technicians Association, (MTA), USA
Canadian Society of Technical Analysts, (CSTA), CANADA
Society of Technical Analysts, STA (UK)


+91-70164-32277  /  +91-98250-16331