Saturday, December 31, 2016

WEEKLY MARKET OUTLOOK FOR JANUARY 02 THRU JANUARY 06, 2017

WEEKLY MARKET OUTLOOK FOR JANUARY 02 THRU JANUARY 06, 2017
We had expected in our previous Weekly note that the Markets may remain stable and attempt making of supports in 7900-7920 zones. Keeping in line with this analysis, the NIFTY ended the last trading day of the year 2016 on a buoyant note and ended the Week with net gains of 200.05 points or  2.51%. In the coming week, we can fairly expect the 7900-7920 zones at firm support for the Markets. We expect the NIFTY to consolidate at higher levels. It may reach its logical levels of 8250-8275 levels and consolidate at those levels as they hold multiple pattern resistance levels. With a positive bias, the Markets will consolidate. Some amount of volatility will remain and minor intermittent profit taking bouts cannot be ruled out.

For the coming week, the levels of 8200 and 8260 will hold as immediate resistance levels. The supports come in at 8110 and 8060 levels.

The RSI—Relative Strength Index on the Weekly Chart is 46.1442 and it remains neutral as it shows no bullish or bearish divergence or any failure swings. The Weekly MACD is bearish as it trades below its signal line. However, it has potentially marked its lows and is moving towards positive crossover in coming weeks. On the Candles, an Engulfing Bullish Pattern has occurred. Importantly this pattern has occurred after a downtrend and some consolidation and therefore it marks the present lows at as potential bottom.

While having a look at pattern analysis, the NIFTY has nearly 50% of its rally from 6900 to 8900-odd mark and this retracement of 50% has held as its support for the immediate short term. The NIFTY had marked a potential bottom around 7916 levels and while the NIFTY took support once again near these levels, it has potentially confirmed this support. It would be crucially important now for the NIFTY to maintain this support and confirm the reversal by forming a higher tops and higher bottoms on the Charts.

All and all, the coming week is likely to remain positive and though we cannot expect any runaway rise once again, the NIFTY will continue to mark modest gains with positive bias. The sector rotation is very much evident since last previous two weeks and select pockets will continue to support the Markets and out-perform. Positive outlook is advised for the coming week. The softening of yields and the Rupee is remaining relatively stable and in capped range with aid this reading in the coming week.

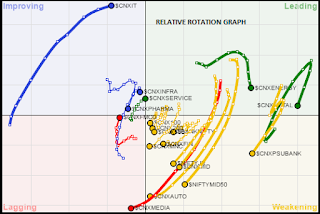
A study of Relative Rotation Graphs – RRG suggest though ENERGY and METAL stocks will continue to lead the Markets, we will see them slowly losing momentum and some amount of profit taking can be expected. IT stocks will continue to outperform and we will see continued and improved performance from FMCG stocks as well. CNXSERVICE and INFRA stocks are also likely to do well. MEDIA stocks are expected to lag and considerable loss of momentum can be expected in PSUBANK, CNXMEDIA, CNXMID and NIFTYJR stocks. However, select stock specific performance within these indices will be seen.

Important Note: RRG™ charts show you the relative strength and momentum for a group of stocks. In the above Chart, they show relative performance as against NIFTY Index and should not be used directly as buy or sell signals.

(Milan Vaishnav, CMT, is Consultant Technical Analyst at Gemstone Equity Research & Advisory Services, Vadodara. He can be reached at milan.vaishnav@equityresearch.asia)

Milan Vaishnav, CMT
Technical Analyst
(Research Analyst, SEBI Reg. No. INH000003341)
Member
Market Technicians Association, (MTA), USA
Canadian Society of Technical Analysts, (CSTA), CANADA

+91-98250-16331 


Friday, December 30, 2016

Daily Market Trend Guide -- Friday, December 30, 2016

MARKET TREND FOR FRIDAY, DECEMBER 30, 2016
Very much on expected line, the NIFTY resumed its up move after a day’s break and ended the day with decent gains of 68.75 points or 0.86%. We had mentioned in our previous edition that NIFTY not correcting at Close levels even after a gain of 124-points in the previous session is a sign of inherent strength. NIFTY continues to display buoyancy and today we expect as stable and positive start to the Markets and the NIFTY is likely to continue with its gains at least in the initial trade. In the given circumstance, the logical targets for the NIFTY can be its 200-DMA which stands at 8258.

For today, the levels of 8165 and 8220 will act as immediate resistance levels for the Markets. The supports come in at 8065 and 8020 levels.

The RSI—Relative Strength Index on the Daily Chart is 48.2825 and it continues to remain neutral as it shows no bullish or bearish divergence or any failure swings. The Daily MACD, as we had expected in our previous edition has reported a positive crossover and it is now bullish while trading above its signal line. On Candles, an engulfing bullish line has occurred and given the structure of the Chart, it is very much likely that it will fuel the up move in the next session. However, this needs confirmation.

On the derivative front, the NIFTY January series has added over 33.98 lakh shares or 26.66% in Open Interest resulting into net addition of Open Interest over December futures.

Coming to pattern analysis, two things stands established. First, the levels of 7900-7920 have continued to hold as immediate short term support. Secondly, this level has also seen a important pattern formation of a Double Bottom and this is likely to continue to lend support to the Markets in the immediate short term. However, it is important to note that the bottoms have been formed but the reversal is yet to be confirmed. Confirmation will occur once the NIFTY moves past 200-DMA and sustains above that.

Overall, the buoyancy is likely to continue. Though some intermittent profit taking bouts cannot be ruled out, at no point the Charts warrants creation of fresh short exposures. Dips should be continued to be utilized to make select purchases. Sector rotation has once again become evident and IT and FMCT and select energy and Midcaps are likely to remain in focus. Overall, we continue to have positive outlook on the Markets for today.

Milan Vaishnav, CMT
Technical Analyst
(Research Analyst, SEBI Reg. No. INH000003341)
Member: Market Technicians Association, (MTA), USA 
Canadian Society of Technical Analysts, (CSTA), CANADA


+91-98250-16331 
Thursday, December 29, 2016

Daily Market Trend Guide -- Thursday, December 29, 2016

MARKET TREND FOR THURSDAY, DECEMBER 29, 2016
After a typically rollovers dominated volatile session, the NIFTY ended the day on absolutely flat note while ending with negligible gains of 2 points or 0.02%. Though the NIFTY came off nearly 60-odd points from the high point of the day, its ending flat after a gain of over 124 points in previous session displays good amount of strength that it displayed at Close levels. Today, we expect a flat to modestly positive start to the Markets and we expect the Markets to trade stable with positive bias. Volatility will remain as we enter the expiry of the current derivative series.

For today, the levels of 8100 and 8135 will act as immediate resistance levels while supports will come in at 8010 and 7965 levels.

The RSI—Relative Strength Index on the Daily Chart is 43.0469 and it remains neutral as it shows no bullish or bearish divergence or any failure swings. The Daily MACD still remains bearish as it trades below its signal line. However, if the NIFTY maintains current levels with positive bias, we may see a positive crossover on this indicator. On the Candles, a long upper shadow occurred. This formation is relatively less significant as it has not occurred during a rally or at near high price levels.

On the derivative front, the NIFTY December futures shed over 27.23 lakh shars or 20.51% in Open Interest while January series added over 11.75 lakh shares or 10.76% in Open Interest. NIFTY PCR continues to hover around 1.

While having a look at pattern analysis, the NIFTY has reaffirmed the support at 7900-7920 zones. The reason being that it was a important pattern support in form of a Double Bottom and in the session before this, it reaffirmed as it saw a strong rally from these lows. Going forward, so long as the NIFTY trades above 7920 levels, we will continue to see positive bias in the Markets. However, given the overall structure of the Charts, we can expect the Markets to consolidate more and any runaway rise is not expected. Going ahead, the levels of 8275 will be important levels to watch for.

Overall, we continue to recommend remaining light in the Markets. Major exposures should be avoided until the NIFTY confirms the reversal and the recent bottom. Until then buying modest quantities of select stocks can be done. Select stocks and sectoral out-performance will remain evident. Volatility will remain ingrained as we head into the expiry of the current derivative series. Overall, positive caution is advised for today.

Milan Vaishnav, CMT
Technical Analyst
(Research Analyst, SEBI Reg. No. INH000003341)
Member
Market Technicians Association, (MTA), USA
Canadian Society of Technical Analysts, (CSTA), CANADA


+91-98250-16331 

Wednesday, December 28, 2016

Daily Market Trend Guide -- Wednesday, December 28, 2016

MARKET TREND FOR WEDNESDAY, DECEMBER 28, 2016
We had mentioned in our previous edition that given the short positions in the Markets, a technical pullback cannot be ruled out. The Markets yesterday gave a much expected relief rally and held on to its pattern support of the 7900-7920 zones while it ended the day on a decent gain. Yesterday’s  session was important in many ways as it re-established the 7900-7920 as  its major pattern support and also prevented any major breakdown on the Charts. Today, we can expect a stable opening and NIFTY is likely to continue with its up move at least in the initial trade. However, the NIFTY is still not completely out of the woods and its maintenance of certain levels will remain of critical importance going down the remaining week.

For today, the levels of 8065 and 8110 will act as immediate resistance levels for the Markets. The levels of 7960 and 7900 will continue to act as critical supports.

The RSI—Relative Strength Index on the Daily Chart is 42.8907 and it is neutral as it shows no bullish or bearish divergence or any failure swings. The Daily MACD is still bearish as it trades below its signal line. If the NIFTY maintains its current levels and consolidate, we might be again moving towards a positive crossover on this indicator. On the Candles, a Big White Candle has occurred. This formation is significant. This Big White Candle has occurred near a important pattern support and therefore it has added credibility to this support.

On the Derivative front, the NIFTY December futures have shed over 11.30 lakh shares or 7.85% in  Open Interest. Though given the expiry and rollovers, these figures may not be of any singular importance but it makes evident that there was a large scale short covering in the previous session.

If we have a look at pattern analysis, the NIFTY had closed mildly below 7900-7920 support zones. This was a important pattern support in form of a Double Bottom. We had mentioned in our previous edition that opening and sustaining above 7900-7920 zones would be important for the Markets. In coming days, if the NIFTY consolidates these levels will continue to act as important supports.

Overall, we might continue to see the up move being continued in the initial trade. However, NIFTY has much to cover beyond a day of pullback and it is likely to continue to consolidate at higher levels with positive bias. Today is a penultimate day of the expiry of current derivative series and the session will remain dominated with rollovers. However, sectors like FMCG, select Pharma stocks and IT along with select pockets of Energy is likely to see out-performance. Unrelenting US  Bond Yields and strength of the USD will have to be watched for.

Milan Vaishnav, CMT
Technical Analyst
(Research Analyst, SEBI Reg. No. INH000003341)
Member
Market Technicians Association, (MTA), USA
Canadian Society of Technical Analysts, (CSTA), CANADA


+91-98250-16331 

Tuesday, December 27, 2016

Daily Market Trend Guide -- Tuesday, December 27, 2016

MARKET TREND FOR TUESDAY, DECEMBER 27, 2016
The start to the trading week remained grossly disappointing as the NIFTY continued with its slide and tested its Brexit lows, and an important pattern supports while ending with a loss of 0.97%. The Markets reacted negatively to the PM’s remarks in Mumbai on Saturday. Today, we continue to hang in a precarious balance and the behavior of the Markets vis-à-vis the levels of 7900-7920 zone will decide the trend in remaining week. There were good amounts of shorts that were added and the NIFTY premium narrowed to trade almost at par. Today, we expect a fairly stable start but trading above the levels of 7900 would be crucially important for the Markets.

For today, the levels of 7920 and 7995 will act as immediate resistance levels for the Markets. The supports will come in at 7950 and 7905 levels.

The RSI—Relative Strength Index on the Daily Chart is 32.1230 and this has reached its lowest value in last 14-days which is bearish. It does not show any bullish or bearish divergence. This indicator trades near to its oversold territory but is not yet oversold. The Daily MACD remains bearish while trading below its signal line.

On the derivative front, the NIFTY December futures have added yet another 8.06 lakh shares or 5.93% in Open Interest. The decline in NIFTY with addition of significant open interest indicate addition of shorts in the system. This is further supported by the reduction in the NIFTY futures premium to the spot.

Coming to pattern analysis, the NIFTY has declined nearly 300-odd points in previous 8 sessions. It has violated its immediate low of 7920 levels and has closed marginally below this. This level was expected to act as an important pattern support in form of a minor Double Bottom but with the NIFTY closing a notch below this, this support level has become an important point to watch for. For the NIFTY to avoid any serious weakness, it will have to move and trade above 7900-7920 mark and maintain itself above that. Any further downsides at Close levels will bring in some more pain in the immediate short term.

Reading of the structure of the Chart, which is fairly bearish, some amount of weakness persisting cannot be ruled out. On the other hand, NIFTY has added good amount of shorts and with the expiry happening in the current week, technical pullback can also be expected from lower levels. Though the support of 7900-7920 has not been grossly violated as of now, we recommend completely refraining from creating any directional exposures until expiry gets over.

Milan Vaishnav, CMT
Technical Analyst
(Research Analyst, SEBI Reg. No. INH000003341)
Member
Market Technicians Association, (MTA), USA
Canadian Society of Technical Analysts, (CSTA), CANADA


+91-98250-16331 

Monday, December 26, 2016

Daily Market Trend Guide -- Monday, December 26, 2016

MARKET TREND FOR MONDAY, DECEMBER 26, 2016
The Markets halted their more-than-a-week-old losing streak as it came off its lows on Friday to end the day flat with minor gain of 6.65 points or 0.08%. Today, we enter the expiry week and we may see the coming sessions dominated with rollovers. Today, we may see a stable opening in the Markets and NIFTY may attempt an up move in the initial trade. However, the Markets continue to hang in precarious balance with the levels of 7916 not broken yet. It would be crucially important for the Markets to maintain above the recent lows of 7916. Any breach below this is likely to bring in more weakness in the immediate short term.

For today, the levels of 8045 and 8070 are likely to act as immediate resistance levels while the supports are likely to come in at 7916 and 7850 levels.

The RSI—Relative Strength Index on the Daily Chart is 36.0486 and it is neutral and does not show any bullish or bearish divergence or any failure swings. The Daily MACD is bearish as it trades below its signal line. On Candles, no significant formation is observed.

On the derivative front, the NIFTY December futures have added over 7.07 lakh shares or 5.49% in Open Interest. This is a mild indication we might have seen buying coming in from 
lower levels on Friday.

While having a look at pattern analysis, it is now very much evident on the Daily Charts that though the NIFTY has formed its immediate bottom at 7916, it has not confirmed this bottom as yet. It attempted to pullback and even moved past the levels of 200-DMA but it failed to sustain at those levels and retraced back. Though, currently it shows no structural breach on the Daily Charts as it stands above 7916, an important pattern support in form of recent lows. As mentioned earlier, it would be crucially important for the NIFTY to sustain above the 7916 levels if it has to avoid any fresh weakness from setting in.

Overall, with the lows of 7916 still being held by NIFTY we would reassert not creating any major short positions as so long as NIFTY trades above 7916, we cannot rule out short covering from lower levels. Fresh purchases may be made but in very modest quantities. While NIFTY continues to consolidate, liquidity should be maintained while the Markets decides its directional bias.

Milan Vaishnav, CMT
Technical Analyst
(Research Analyst, SEBI Reg. No. INH000003341)
Member
Market Technicians Association, (MTA), USA
Canadian Society of Technical Analysts, (CSTA), CANADA
Association of Technical Market Analysts, (ATMA), INDIA

http://milan-vaishnav.blogspot.com


+91-98250-16331