Friday, April 1, 2016

Daily Market Trend Guide -- Friday, April 01, 2016

MARKET REPORT                                                                                      April 01, 2016
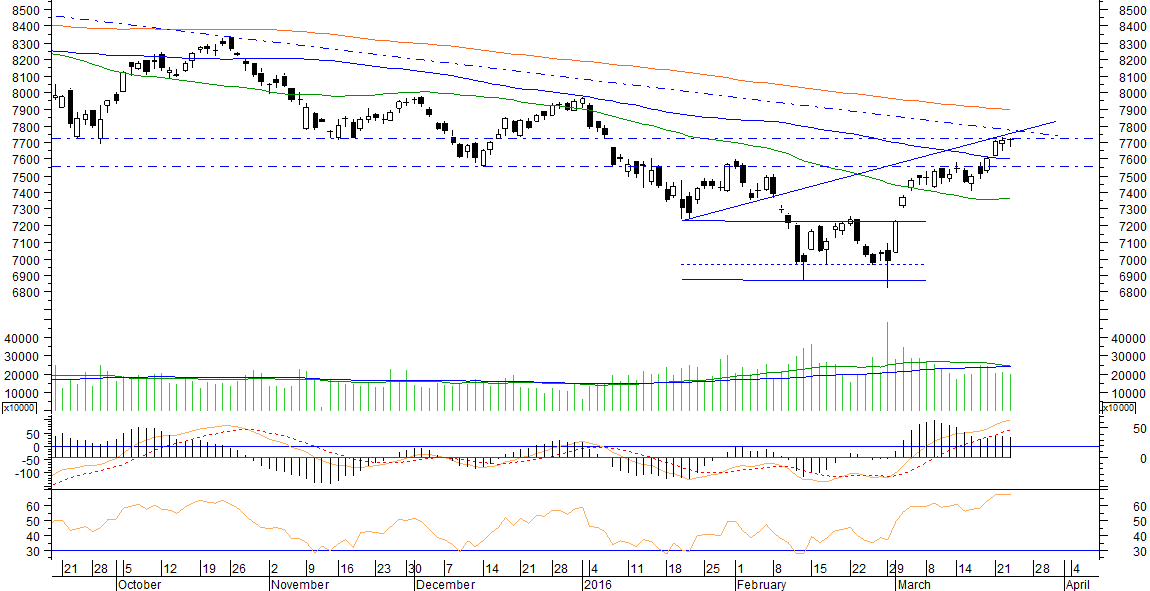
The technical factors prevailed over the Markets as the Markets failed to move past its pattern resistance and ended the day flat with nominal gains after coming off from its intraday highs. The Markets saw a flat opening and after opening modestly on a negative note it soon crawled into the positive territory. It went on to strengthen itself in the morning trade while it formed its intraday high of 7777.60. However, it got itself in sideways trajectory in the early afternoon trade. The Markets were unable to hold on to its gains and by midsession had pared all of its gains to trade flat. It did saw a spurt in the later part of the afternoon but that was not sustained either as it was followed by a near vertical paring of gains where the Markets formed its intraday low of 7702. With some recovery, it finally settled the day at 7738.40, posting a flat close with minor gains of 3.20 points or 0.04% while forming a higher top and higher bottom on the Daily Bar Charts.

MARKET TREND FOR FRIDAY, APRIL 01, 2016
Caution is likely to prevail in the Markets as the Markets are expected to open on a modestly negative note. The Markets, as of now, has failed to clear its important pattern resistance of a falling trend line and with the expected lower opening, the zone of 7730-7760 will continue to pose resistance to the Markets. On the downside, the levels of 100-DMA is expected to act as support. The intraday trajectory that the Markets form after opening would be important to watch out for.

For today, the levels of 7750 and 7785 will act as important resistance levels for the Markets. The supports come in much lower at 7650 and 7610 levels.

The RSI—Relative Strength Index on the Daily Chart is 64.4578 and it does not show any failure swing. However, RSI has set a fresh 14-period low whereas NIFTY has not yet and this is Bearish Divergence.  Daily MACD is bullish as it still continues to trade above its signal line.  On the Candles, a Spinning Top has occurred. Such formations often tend to have potential to halt the up moves temporarily.

On derivative front, NIFTY witnessed over 68.20% of rollovers and the Market Wide rollovers were seen over 72%. The April series saw addition of over 46.78 lakh shares or 32.97%  in Open Interest. The NIFTY PCR stands at 1.10 as against 1.08.

Coming to pattern analysis, the Markets have resisted to one of its important pattern resistances; a falling trend line drawn from 8600 levels. The Markets have been oscillating back and forth while resisting to this falling trend line and taking support on its 100-DMA on the lower side. Today, with modestly lower opening expected, the Markets are likely to continue to resist to this pattern resistance and subsequently, the 100-DMA, which is 7583 is expected to act as support at Close levels.

Overall, the resistance zone of 7730-7760 continues to hold good as of today and the Markets will not witness any runaway up moves until it significantly moves past this level. As of now, the 100-DMA holds as important support failing which 7550 may be tested. We continue to reiterate our cautious outlook on the Markets while continuing to keep fresh purchases and very moderate levels. Cautious outlook for the day is advised.


Milan Vaishnav,
Consulting Technical Analyst

Member: Market Technicians Association, (MTA), USA
Member: Association of Technical Market Analysts, (ATMA), INDIA

+91-98250-16331

Thursday, March 31, 2016

Daily Market Trend Guide -- Thursday, March 31, 2016

MARKET REPORT                                                                                       March 31, 2016
The Markets posed a strong comeback as it ended the day with robust gains but continued to remain within its pattern resistance levels. The Markets saw a positive opening aided by positive global set up and remained in positive territory throughout the session. The Markets saw a near gap up opening and after this it remained in upward rising trajectory. Such structure of the Markets remained throughout the session and there was no one point where it witnessed any pressure. It kept making gradual intraday highs and towards the end formed its intraday high of 7741.95. It finally settled the day at 7735.20, posting a net gain of 138.20 points or 1.82% while forming a higher top and higher bottom on the Daily Bar Charts.

MARKET TREND FOR THURSDAY, MARCH 31, 2016
Even after witnessing a robust up move, the Markets still continue to remain within the ambit of its resistance levels. Today would be a critical session as not only the Markets may open flat around its pattern resistance and attempt to find directions, but today is also expiry day of the current derivative series and this would see the session remain severely dominated with rollovers. Any move above 7750 levels will see the Markets testing inching upwards. If the Markets fail to do so we will once again see them consolidating in a given range.

For today, the levels of 7750 and 7795 will act as immediate resistance levels for the Markets. The supports come in lower at 7650 and 7610 levels.

The RSI—Relative Strength Index on the Daily Chart is 64.3221 and it remains neutral as it shows no bullish or bearish divergence or any failure swing. The Daily MACD stays bullish as it trades above its signal line.

On the derivative front, the NIFTY March futures shed over 15.88 lakh shares or 9.90% in Open Interest. The April series added over 28.61 lakh shares or 25.26% in Open Interest resulting in net addition in OI. The NIFTY PCR stands at 1.08 as against 0.96.

Coming to pattern analysis, even though the Markets saw a robust up move yesterday, it still resisted to the falling trend line drawn from 8600 levels. Having said this, with today’s flat opening expected, the Markets will spend some time around this level of 7750 and it would be important to see if the Markets are able to move past this falling trend line resistance. If the Markets are able to move past this level, we can expect to test 7800-7825 levels on the Charts. However, in the event of the Markets not breaching 7750 on the upside, we will continue to remain in broad consolidation with some intermittent selling bouts from higher levels.

Overall, with today being the expiry day, we cannot rule out volatility remaining ingrained in the session. The levels of 7750 will be important to watch out for and some runaway rally would occur if the Markets move past this level. However, with the Markets still trading within the ambit of its resistance levels we continue to reiterate to use every up move to book and protect profits at higher levels. Cautious outlook on the Markets is advised for the day.

Milan Vaishnav,
Consulting Technical Analyst

Member: Market Technicians Association, (MTA), USA
Member: Association of Technical Market Analysts, (ATMA), INDIA

+91-98250-16331


Wednesday, March 30, 2016

Daily Market Trend Guide -- Wednesday, March 30, 2016

MARKET REPORT                                                                                        March 30, 2016
The Markets thoroughly consolidated yesterday and ended the day with modest losses though it was able to maintain itself above its 100-DMA. The Markets saw a flat opening and after opening on a quiet note, the Markets put on some minor gains in the morning trade. However, it soon pared those gains in the late morning trade and by afternoon, it went on to slip into negative to form day’s low of 7582.25. Taking support precisely at its 100-DMA the Markets reversed and managed to recoup some of its losses. It continued to oscillate in 40-odd points range for the entire session and at one point formed its day’s high of 7652.90 in the late afternoon trade. However, it pared those gains again and after slipping into negative, finally settled the day at 7597, posting a net loss of 18.10 points or 0.24% while forming a lower top and lower bottom on the Daily Bar Charts.


MARKET TREND FOR WEDNESDAY, MARCH 30, 2016
The Markets are likely to see a positive opening today as the global set up remains positive following dovish Federal Reserve statements. However, speaking purely on technical grounds, the analysis continues to remain similar on yesterday’s lines. The Markets may see positive opening but at the same time, there are chances that the rallies may get sold into. There are chances that the Markets continue to consolidate and the levels of 100-DMA continue to act as support.

For today, the levels of 7650 and 7685 will act as immediate resistance on the Daily Charts. The supports come in at 7589 and 7550 levels.

The RSI—Relative Strength Index on the Daily Chart is 57.8685 and it remains neutral as it shows no bullish or bearish divergence or any failure swing. The Daily MACD is bullish as it trades above its signal line. However, the slope of histogram is seen sloping indicating some loss in strength on temporary basis.

On derivative front, heavy rollovers continued as the March NIFTY futures shed over 26.94 lakh shares or 14.37% in Open Interest and April futures added over 47.53 lakh shares or 72.30% in Open Interest indicating net addition in Open Interest.

While having a look at pattern analysis, the overall pattern analysis also continues to remain in line with our yesterday’s view. The levels of 7720-7750 have become immediate top for the Markets and the trend line to which the Markets resisted at these levels is a falling trend line drawn from 8600 levels. With each passing day, this trend line, due to its falling nature, lowers the resistance levels for the Markets. To make it simple, entire 7700-7750 zones have become resistance zone for the Markets as the Markets meets more than one pattern resistance levels.  Any runaway rally would occur only if the Markets are able to move past the 7750 level and until that happens, irrespective of the openings that we get, we will continue to consolidate in a capped range and there would always remain a possibility of intermittent selling bouts from higher levels.

Overall, we also enter the penultimate day of expiry of current derivative series and the trade is bound to remain affected and dominated with rollovers. While continuing with our yesterday’s view, we reiterate that any rallies and higher openings should be better utilized to book and protect profits and new positions should be kept limited. Overall, continuance of cautious outlook is advised for today.


Milan Vaishnav,
Consulting Technical Analyst

Member: Market Technicians Association, (MTA), USA
Member: Association of Technical Market Analysts, (ATMA), INDIA

+91-98250-16331

Tuesday, March 29, 2016

Daily Market Trend Guide -- Tuesday, March 29, 2016

MARKET REPORT                                                                                      March 29, 2016
The Markets, very much on expected lines, finally saw some much awaited correction setting in as it opened flat, drifted lower to test its 100-DMA and ended the day with losses. The Markets saw a flat opening as it attempted to adjust itself to the global trade set-up as it opened after holidays. It remained in the positive territory for a very brief period as it formed its intraday high of 7749.40 in the very early minutes of the trade. It soon drifted into the red and traded with limited losses in the first half of the trade. The losses widened in the second half of the session as the Markets rapidly lost ground. It went on to test its 100-DMA while it formed its intraday low of 7587.70. Minor recovery was observed and the Markets finally settled the day at 7615.10, posting a net loss of 101.40 points or 1.31% while forming a higher top but sharply lower bottom on the Daily Bar Charts.


MARKET TREND FOR TUESDAY, MARCH 29, 2016
The correction that we saw yesterday in the Markets was much awaited and due as the weakness was evident on the Daily Charts. Though the Markets took supports at its 100-DMA yesterday, today we can once again expect a flat opening to the Markets. In the same way, our analysis remains similar on yesterday’s lines. We believe that the behavior of the Markets vis-à-vis the 100-DMA would be critical to watch out for. It is likely that the Markets briefly takes support at these levels but may continue to see weakness in the later part of the session.

For today, the levels of 7640 and 7690 are immediate resistance levels for the Markets. The supports come in at 7585 and then at 7550 levels.

The RSI—Relative Strength Index on the Daily Chart is 59.1701 and it remains neutral as it shows no bullish or bearish divergence or any failure swings. The Daily MACD, however, remains bullish as it trades above its signal line.

On the derivative front, the NIFTY March futures have shed over 29.86 lakh shares or 13.74% in Open Interest whereas April series added over 16.71 lakh shares or 34.08% in 
Open interest resulting in net addition in OI as rollovers continued to take place.

Coming to pattern analysis, the Markets reacted precisely to its multiple pattern resistance zones of 7720-7750 levels. Yesterday’s high of 7749 has become a immediate top for the Markets for the near term and there will be no runaway rally in the Markets until it moves past 7750 levels. Until this happens, we are likely to witness some more correction in the Markets wherein the 100-DMA and then the pattern support of 7550 will be the key levels to watch out for. Any breach below 7550 levels will bring in some more weakness in the Markets. On the upside, the zones of 7720-7750 will continue to act as immediate key pattern resistance formed by falling trend line drawn from 8600 levels will continue to pose resistance.

Overall, the Markets may continue to witness intermittent pullbacks but as mentioned earlier, there will be no runaway rally until the Markets moves past 7750 levels. Just like on yesterday’s analyzed lines, we continue to reiterate to continue to protect profits with every rise and lay more emphasis on protection of profits. Purchases may be done, but on very moderate levels. Continuance of cautious outlook is advised for today.

Milan Vaishnav,
Consulting Technical Analyst

Member: Market Technicians Association, (MTA), USA
Member: Association of Technical Market Analysts, (ATMA), INDIA

+91-98250-16331


Monday, March 28, 2016

Daily Market Trend Guide -- Monday, March 28, 2016

MARKET REPORT                                                                                     March 28, 2016
Markets continued to display remarkable strength while also resisting at key levels as it recovered from the lows of the day to end the day flat with nominal gains. The Markets saw a flat opening and it soon slipped into the red in the morning trade. After spending the morning trade in a capped range, the Markets slipped further and by afternoon session, it went on to form the day’s low of 7670.60. It was in the second half of the session that the Markets saw recovery coming in. The Markets reversed its intraday trend, formed a upward rising trajectory and recouped all of its losses to trade in the positive territory. It went on to form the day’s high of 7726.85. It finally settled the day at 7716.50, posting a flat close with nominal gains of 1.60 points or 0.02% while forming a similar top and slightly higher bottom on the Daily Bar Charts.

MARKET TREND FOR MONDAY, MARCH 28, 2016
Markets will open today after trading holidays on Thursday and Friday. Today’s opening is likely to witness the adjustment to the global trade set-up on these two days on which the Markets was closed. The opening today is likely to remain flat and the Markets will look for directions and adjustments. There are high chances that we will see the Markets continuing to consolidate and good amount of chance that it would witness some minor profit taking from higher levels.

For today, the Markets are face likely resistance at 7730 and 7745 levels. Supports come lower at 7670 and 7610 levels.

The RSI—Relative Strength Index on the Daily Chart is 67.0111 and it has just reached its highest value in last 14-days which is bullish. However, it does not show any bullish or bearish divergence on the Charts. The Daily MACD stays bullish as it trades above its signal line. On the Candles, a Doji Star occurred. This has followed a candle with long lower shadow and it has some potential to pause the up move of the Markets. On the Weekly Charts, the Weekly RSI is 50.9199 and it has reached its highest value in last 14-days which is bullish. The Weekly RSI has also formed a fresh 14-week high whereas the NIFTY has not yet and this is Bullish Divergence. The Weekly MACD remains bullish as it trades above its signal line.

On the derivative front, the NIFTY March futures have added over 6.39 lakh shares or 3.03% in Open Interest. Some amount of rollovers has also been witnessed.

Coming to pattern analysis, the Markets after pulling back over 900-odd points from the lows of the Budget session, have moved past its important resistance levels of 7550 and also its 100-DMA thereafter. Following this, it now finds itself near a multiple pattern resistance once again and there are bright chances that the Markets consolidate at these levels. There is also fair amount of likelihood that the Markets may witness some amount of profit taking from higher levels as well. Though the lead indicators on the Daily and Weekly Chart indicate a bullish set up, the Markets resisting at its pattern resistances just cannot be ruled out. Some amount of consolidation would be in fact healthy for the Markets in the immediate short term. Given the overall set up on the technical charts, runaway rise is something that would not be expected.

Overall, we also enter the expiry week of the current derivative series. We will continue to see the trade dominated with rollover centric activities and this will infuse some amount of volatility in the Markets as well. The zones of 7730-7765 will act as a major resistance for the Markets going upwards. While remaining in line with this analysis, we continue to reiterate our cautious stand on the Markets and advice more emphasis on protecting profits at higher levels while keeping fresh purchases to moderate levels.


Milan Vaishnav,
Consulting Technical Analyst

Member: Market Technicians Association, (MTA), USA
Member: Association of Technical Market Analysts, (ATMA), INDIA

+91-98250-16331