MARKET REPORT February
12, 2016
What we saw yesterday was a example of “selling excess” as the Markets opened gap
down, and went down even more sharply to end the day with a deed cut. The Markets ended almost around its
May 2014 levels. The Markets, while tracking weak global cues opened with a gap
down and traded sideways in the first half of the session, though no attempt to
recover from the opening lows was seen. The great weakness crept in the second
half of the session where the Markets saw very sharp selling pressure. The Markets
not only breached its all possible intraday support levels but went below its
psychological 7000-mark to form the day’s low of 6959.95. The weakness
persisted until very end with virtually no major recovery happening, the
Markets ended the day at 6976.35, posting a very deep cut of 239.35 points or
3.32% while forming a sharply lower top and lower bottom on the Daily Bar
Charts.

MARKET TREND FOR FRIDAY, FEBRUARY 12,
2016
Speaking purely on technical terms, what we
witness yesterday was a “selling excess” or “selling extreme” which often
accompanies the final phases of a sharp downsides. Such action on the Charts is
one of the major attempts to find a bottom for the immediate short term. Today,
we are likely to see a decently positive opening and though it can be merely on
account of short covering, we are likely to see some relief rally in the first
half of the session.
However, as usual, in order to such formations to sustain,
it would be extremely important of the
Markets to maintain its opening gains.
For today, the levels of 7065 and 7090 will
act as immediate possible resistance levels. The supports would come in at 6950
and 6910 levels.
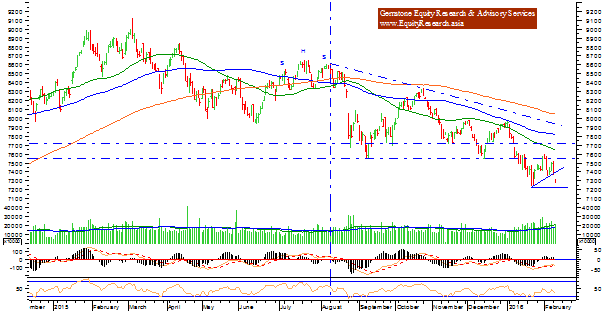
The RSI—Relative Strength Index on the
Daily Chart is 27.7804 and it has reached its lowest value in last 14-days
which is bearish. However, it now trades in the “oversold” territory. The Daily
MACD is bearish as it trades below is signal line.
On the derivative front, the NIFTY February
futures have added over 10.90 lakh shares 5.85% in Open Interest. This
indicates massive addition of fresh short positions in the system. The NIFTY
PCR stands at 0.78 as against 0.82.
Coming to pattern analysis, the Markets
held its original support level of 7540 that it broke
on its way down as
sacrosanct and while pulling back resisted to it twice. Since resisting it came
off heavily and went on to make fresh 52-week lows in recent sessions.
Yesterday, it went on to breach its recent 52-week low of 7240 and saw a sharp
decline the moment the levels were breached. It formed it slow well below that
and below the psychological 7000-mark. Having said this, as mentioned above,
there are chances that the Markets have formed a pattern known as “selling
extreme” on its charts. This is a major attempt to find a bottom for the short
term. If the possible positive opening in the Markets are sustained, it is all
likely that the Markets have formed its bottom for the immediate short term and
some technical relief rally cannot be ruled out.
All and all, as mentioned above, even if we
witness a rally, initially it is likely to be just on back of short covering as
profit booking in short positions is likely to be witnessed. It is advised to
refrain from fresh shorting at any levels. The technical pullback, if any, is
likely to lead the Markets around 7240 levels, again at which we will see some
pattern area formation. Until any pattern area formation occurs, it is best advised
to keep the exposure very limited and adopt heavily cautious outlook on the
Markets.
Milan Vaishnav,
Consulting Technical Analyst
Af. Member: Market
Technicians Association, (MTA), USA
Af. Member: Association of Technical Market Analysts, (ATMA),
INDIA
+91-98250-16331