We
have not been able to come out with today's edition of Daily Market
Trend Guide in regular PDF Format. We are producing below "Brief Market
Forecast for the Day". Inconvenience caused is sincerely regretted.
_________________________________________________________________________________________________
BRIEF MARKET FORECAST FOR THE DAY -- FRIDAY, JUNE 26, 2015
The
Markets ended near the high point of the day after it strengthened in
the second half of the session after trading flat initially. Today, we
can expect the Markets to open on a mildly negative note and trade
negative in the initial trade. However, given the consolidation it has
seen, there are chances that the Markets improves as we go ahead in the
session in case it opens on a negative note.
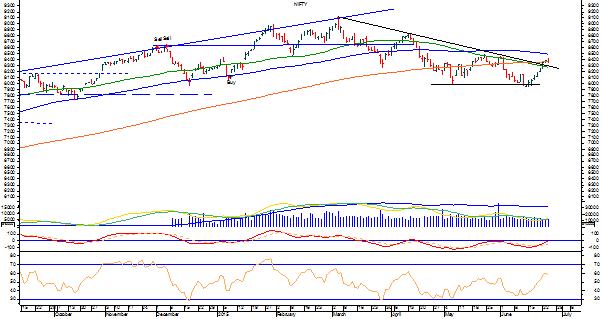
The
lead indicators remain perfectly in place with RSI on the Daily Charts
at 60.4013. It has reached its highest value in last 14-days and is
bullish. The Daily MACD too is bullish as it trades above its signal
line. On the Derivative front, the NIFTY and Market wide rollovers have
been slightly below its 3-month average. Further, NIFTY has added over
23 lakh shares in Net Open Interest and has started the series with the
PCR of 1.04.
Overall,
though we may see some negative opening in the initial trade, the
levels of 8370 and 8325 will act as support and the Markets may
consolidate in this given range. However, it is also likely that the
Markets improve post such subdued opening as all other indicators remain
perfectly in place. Any dip may be utilized for modest and selective
buying with vigilant eye on profits at higher levels.
Milan Vaishnav,
Consulting Technical Analyst,
Af. Member: Market Technicians Association (MTA), USA
Af. Member: Association of Technical Market Analysts, INDIA
www.MyMoneyPlant.co.in
Af. Member: Market Technicians Association (MTA), USA
Af. Member: Association of Technical Market Analysts, INDIA
www.MyMoneyPlant.co.in
+91-98250-16331