MARKET REPORT December
08, 2014
Markets remained absolutely in corrective mode as it ended
the day with modest losses after spending the session in falling trajectory.
The Markets saw a relatively flat opening and trade positively in the morning
trade. It was in the morning trade itself that it formed its day’s high of
8588.35. It continued to trade with minor gains in and by afternoon, the
Markets traded flat. The Markets continued to trade in very narrow range around
its previous close until late afternoon, while it slightly dipped into the red.
Though it recovered its losses again to trade flat but the last hour of the
session saw renewed selling pressure as the Markets saw sharp paring of gains.
It went on to form the day’s low of 8523.90 in the last minutes of the session.
It however settled the day at 8538.30, posting a net loss of 26.10 points or
0.30% while forming a slightly lower top and lower bottom on the Daily Bar
charts.
MARKET TREND FOR
MONDAY, DECEMBER 08, 2014
The Markets are not completely out of the woods as it has
been moving in a sideways trajectory for couple of days now. Expect the Markets
to open with modest gains but at the same time it would continue to resist to
the upper rising trend line. The Markets would continue to face selling
pressure at higher levels even if it sees positive opening. Therefore, the
analysis, would continue to remain more or less on similar lines due to the
sideways consolidation on the Charts.
The levels of 8590 and 8645 would act as immediate
resistance. The supports would come in at 8510 and 8430 levels.
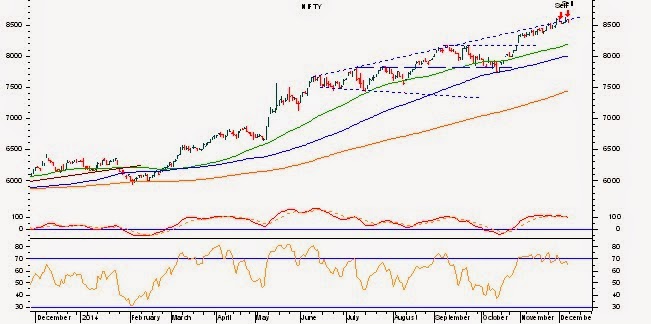
The RSI—Relative Strength Index on the Daily Chart is
64.9443 and it has reached its lowest value in last 14-days which is bearish.
Further, the RSI has formed a fresh 14-period low while NIFTY has not and this
is Bearish Divergence. The Daily MACD now trades below its signal line and it
therefore bearish. On the Weekly Charts, the Weekly RSI is 72.5433 and it is
neutral as it shows no bullish or bearish divergence or failure swings.
However, it trades in “overbought” area. The Weekly MACD stays bearish while
trading below its signal line.
On derivative front, NIFTY December Futures have added over
2.43 lakh shares or 1.22% in Open Interest. This shows some fresh shorts to
have been created in the system.
Going by the pattern analysis, even on the Weekly Charts,
the Markets have been trading below the upper rising trend line of a Broadening
Formation. As mentioned often in our previous editions, breakouts are very
difficult to achieve because of such formations. Further, lead indicators are
overbought on the Weekly Charts and also show bearish bias on the Daily Charts.
Going by this, even if the under current
remains intact, the Markets will take a while before it gives a clear breakout
on the upside and sustains it as well.
Taking a cue from this, we continue to reiterate our
strategy of keeping fresh purchases limited to very select stocks and good non
index components. Any up moves should be utilized to protect existing profits. Though
the undercurrent remains favorable, some volatile consolidation cannot be ruled
out. While maintaining liquidity, we continue to reiterate caution in the
Markets.
Milan
Vaishnav,
Consulting
Technical Analyst,
Af. Member: Market Technicians Association (MTA), USA
Af. Member: Association of Technical Market Analysts, INDIA
www.MyMoneyPlant.co.in
Af. Member: Market Technicians Association (MTA), USA
Af. Member: Association of Technical Market Analysts, INDIA
www.MyMoneyPlant.co.in
+91-98250-16331
No comments:
Post a Comment
Note: Only a member of this blog may post a comment.