Thursday, April 18, 2013

Daily Market Trend Guide -- Thursday, April 18, 2013

MARKET TREND FOR TODAY                                                                     April 18, 2013
The Markets traded very much in alignment of what was analysed in our yesterday’s edition of Daily Market Trend as it began to consolidate but still maintained the levels above of its 200-DMA. The Markets opened more or less on a flat note and firmed up a  bit in the morning trade. It gave its intraday high of 5732.15 in the late morning trade. The Markets saw some brief sideward movement around these levels and then it saw a sudden paring of all of its gains in the afternoon trade. The Markets came off its highs and dipped momentarily in to the negative territory as it gave its intraday low of 5669. The Markets recovered again into the green but traded in a very narrow and capped range. It finally ended the day at 5688.70 closing absolutely flat with very negligible loss of 0.25 points, while continuing to form a higher top and higher bottom on the Daily High Low charts.


Today’s analysis would remain more or less similar to that of yesterday. The Markets are expected to open on a flat note and look for directions. It would be important for the Markets to remain in positive trajectory and also maintain levels above of its 200-DMA in order to just consolidate and avoid any short term weakness.

For today, the levels of 5715 and 5740 shall act as immediate resistance on the Charts. The supports  come in at 5650 and 5635 levels.

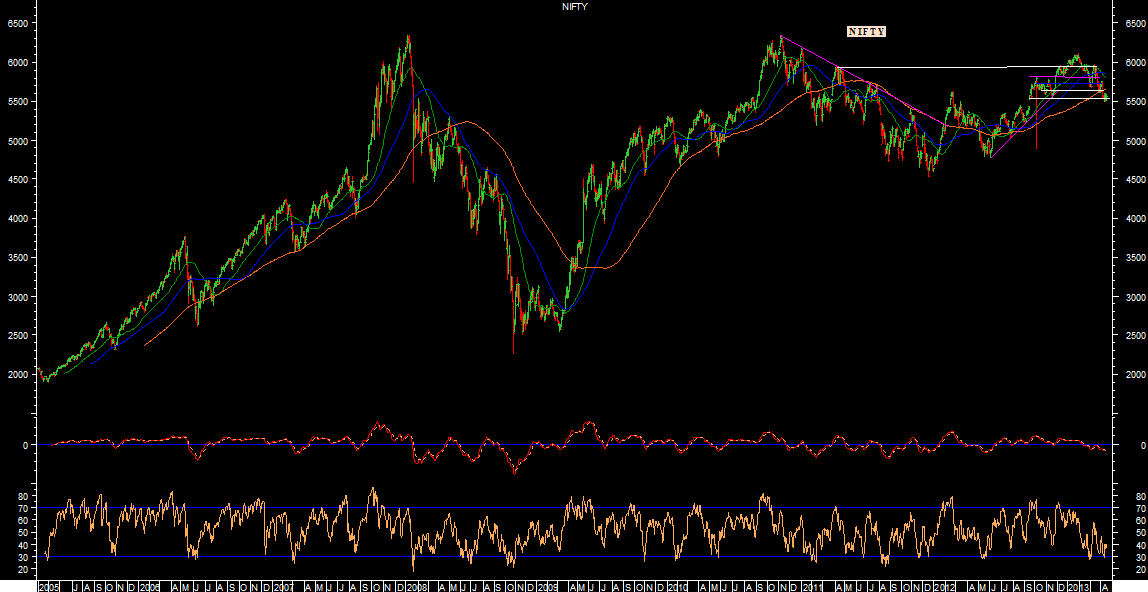
The lead indicators paid a neutral picture. The RSI—Relative Strength Index on the Daily Charts is 51.0093 and it is neutral as it shows no bullish or bearish divergence or any kind of failure swings. The Daily MACD is bullish as it now trades above its signal  line.

On the derivative front,  the NIFTY Futures have further went on to shed over 8.12 lakh shares or 4.10%  in Open Interest. This is a little point to worry as this shows some unwinding in the derivative segments was seen. It is important to see that if some shorts were covered, it has to get replaced by fresh longs.

Overall, given the positive bias of the lead indicators, the derivative data indicates that some short term consolidation or minor correction cannot be ruled out unless we see some fresh longs being built up. Capped movement may also be seen as we have long weekend, tomorrow being trading holiday on account of Ram Navmi.

The Markets shall remain range bound and little volatile and some amount of consolidation or minor correction from higher levels cannot be ruled out given the combined reading of the lead indicators and the derivative data. It is thus advised to continue to remain stock specific until the Markets resumes is up move with conviction. It would be important for the Markets to maintain levels above of its 200-DMA which is 5659.25. Overall continuation of light positions with cautious outlook is advised for today.

Milan Vaishnav,
Consulting Technical Analyst,
+91-98250-16331


Wednesday, April 17, 2013

Daily Market Trend Guide -- Wednesday, April 17, 2013

MARKET TREND FOR TODAY                                                                       April 17, 2013
The Markets staged a very strong pullback yesterday as it opened mildly on a negative note but remained in rising channel throughout the session and ended the day with robust gains. The Markets opened on a mildly negative note and gave its intraday low of 5555.85 in very early seconds of the trade. However, it immediately came into the positive territory and remained in upward rising channel throughout the session. It gradually kept making new intraday highs while it gained further strength in the second half of the session. It went on to give the day’s high of 5699.25. It finally ended the day near that point at 5688.95, posting a robust gain of 120.55 points or 2.16% forming a sharply higher top and higher bottom on the Daily High Low charts.


Today would be very important and critical session for the Markets. The Markets have moved past its 200-DMA, which is 5656.56 today and has closed above it. Further to this, since the Markets have ended the day yesterday near its high point, technically speaking, they are expected to continue with its up move, at least in the initial trade. The Markets are expected to open on a mildly positive note and trade positive and the levels of 200-DMA are expected to act as support in case of any minor profit taking or consolidation.

For today, the levels of 5710 and 5745 shall act as resistance and the levels of 5650 shall act as major support for today.

The lead indicators point towards continuing strength in the Markets. The RSI—Relative Strength Index on the Daily Charts is 51.0295 and it has reached its highest value in last 14-days, which is bullish. Also, RSI has set a new 14-day high whereas NIFTY has not yet, and this is Bullish Divergence. Also, the Daily MACD has reported a positive crossover.  It now trades above its signal line and is bullish.

On the derivative front, however, NIFTY has shed over 16.30 lakh shares or 7.61% in Open Interest. This indicates that yesterday’s up move can be on account of massive short covering of the shorts positions there were seen continuously being  created over last couple of sessions. The key point would be to see if these short positions get replaced by fresh longs.

All and all, given the derivative data, there are mild chances that we see some consolidation or minor profit taking after initial positive charts. There are also equal chances that the Markets continue with its up move as the short covering gets replaced by fresh longs. However, sectoral out performance would continue. Overall, rather than continuing fresh purchases, more concentration should now be laid on protection of profits wherever possible while maintaining a positive but cautious bias on the Markets.

Milan Vaishnav,
Consulting Technical Analyst,
+91-98250-16331


Tuesday, April 16, 2013

Daily Market Trend Guide -- Tuesday, April 16, 2013


MARKET TREND FOR TODAY                                                                  April 16, 2013
Yesterday’s session saw a modest recovery as the Markets opened on a weaker note but gradually recovered in the second half of the session to end the day with modest gains.  The Markets opened on a negative note on expected lines and 5500.30 in the early minutes of the trade. The Markets made its lows as expected in our yesterday’s edition of Daily Market Trend Guide. Post this making of low in the early minutes, the Markets slowly crawled back into the green and remained in upward rising channel as it went on to give the day’s high of 5592.85. The Markets moved in a range in last two hours and finally ended the day at 5568.40, posting a modest gain of 39.85 points or 0.72% while forming a higher to and almost similar bottom on the Daily High Low Charts.


For today, expect the Markets to open on a flat to mildly negative note and look for directions. There are chances that the Markets opens flat to mildly negative and look for directions. As like yesterday, the intraday trajectory would dominate the trend for today also and it would be important to see if the Markets improves as we go ahead in the session or sees some correction again.

For today, the levels of 5510 and 5590 shall act as important supports for today. Resistance levels for today would be 5590 and   5615.

The RSI—Relative Strength Index on the Daily Chart is 40.4563 and it is neutral as it shows no negative divergence or failure swings. The Daily MACD too is bearish as it continues to trade below its signal line.

On the derivative front, NIFTY Futures have once again went on to add over 12.14 lakh shares or 6% in Open Interest. This signifies that there has been fresh open positions that have been added.

Having said this, it would be important to see that the massive amounts of shorts that have been added in the last week act as supports near 5500 levels. There are chances that the Markets continues with its up move but that would come with some amount of volatility ingrained in it.

All and all, there are chances that the Markets continues it pullback again that we saw being started yesterday, but that would still limited up to its 200-DMA levels. The attempt to trend reversal would be there only if the Markets moves  past the levels of 200-DMA. Until this happens it would still remain in overall falling channel even with the pullback within that. So, we continue to remain light on the positions and tread the Markets with heavily selective and cautious approach.

Milan Vaishnav,
Consulting Technical Analyst,
+91-98250-16331


Monday, April 15, 2013

Daily Market Trend Guide -- Monday, April 15, 2013

MARKET TREND FOR TODAY                                                             April 15, 2013
The Markets had a thoroughly disappointing session on Friday as it opened gap down and remained in a capped range thereafter in sideward trajectory till the end of the session to end the day with losses. The Markets opened gap down and after trading sideways, became further weak in the afternoon session as it gave it day’s low of 5494.90. It saw a mild recovery in the second half but did not do much to cut the losses. The movement in the sideways trajectory continued and the Markets finally ended the day at 5528.55, posting a loss of 65.45 points or 1.17% while forming a sharply lower top and lower bottom on the Daily High Low Charts. The Infosys was the biggest loser making  a major dent in the NIFTY which did not cheer the IIP data that was released.


The recovery / pullback that was seen in the Markets in last two session has abruptly came to an end by the Friday’s session. We may see some weaker opening today and can fairly expect the weakness to continue in line with weakness in Asian Markets. European Markets too closed weak on Friday, though US Markets have remained flat. The intraday trajectory would be important to decide the trend post opening and the Markets may test the Friday’s lows.

For today, the levels of 5490 and 5465 shall act as immediate supports for the Markets. The Markets would find resistance at 5540 and 5575 levels.

The RSI—Relative Strength Index on the Daily Chart is 36.2299 and it is neutral as it shows no bullish or bearish divergence or any failure swings. The Daily MACD is bearish as it continues to trade below its signal line. The pattern on the Candles has a “on-neck line”  which is potentially bearish and indicates continuation of weakness for the short term. On the Weekly Charts,  the RSI is 41.0052 and it has just reached the lowest value in last 14-weeks which is bearish. The Weekly MACD continues to trade below its signal line and is therefore, bearish.

On the derivative front, NIFTY Futures have continued to add over 4 lakh shares or 2.05% in Open Interest. Though creation of heavy shorts in the NIFTY has continued, it has also seen selling in the Cash Markets. Stockwide open interest has also added validating this reading.

Having said this, it is also important to note that the Markets have breached the 50-DMA on the WEEKLY Charts. There are fair chances that if the Markets breaches the Friday’s low, it can well slip to 5380-5400 levels.

All and all, there are no directional triggers for the up move in the Markets. Intermittent pullbacks may be seen in this week, but as mentioned often in our previous editions, sustainable up move shall occur only after the Markets moves past its 500-DMA. Until then, any trade that takes place will have a downward bias. Overall, it is advised to refrain from aggressive purchases and maintain high degree of caution in the Markets.

Milan Vaishnav,
Consulting Technical Analyst,
+91-98250-16331