Friday, June 15, 2012

Daily Market Trend Guide -- Friday, June 15, 2012

MARKET TREND FOR TODAY                                                   June 15, 2012
Caution weighed heavy on the Markets yesterday as the Markets took some breather and corrected itself as it ended the day with losses after moderately positive opening as it reacted to Inflation number which were perceived to be high enough to discourage RBI from any aggressive rate cut on Monday. The Markets opened and traded in a range ahead of announcements of Inflation numbers and saw a spurt just ahead of that as it gave its intraday high of 5130. It turned negative soon after that as it kept steadily losing ground and went on to give the day’s low of 5047.60. It finally ended the day 
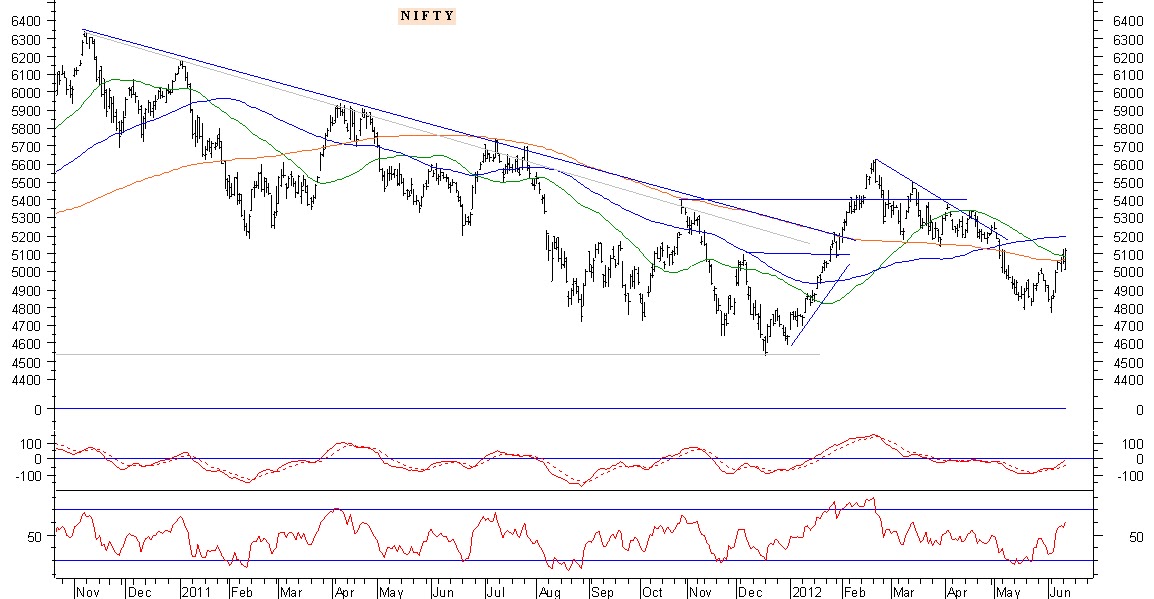
at 5054.75, posting a net loss of 66.70 points or 1.30%. It has formed a lower top and sharply lower bottom on the Daily Charts. The volumes remained  below average.

Today would be a crucially important session for the Markets. The Markets have ended the notch below 200-DMA which is 5070. With moderately positive opening expected today, it would be important for the Markets to open above 200-DMA and sustain the levels above 200-DMA at Close to avoid this consolidation taking a further weakening stance.

The levels of 5495 and 5125 are immediate resistance levels  and the levels of 5020 and 5005 are immediate supports on the Daily Charts.

The lead indicators continue to comfortably remain in place with RSI—Relative Strength Index on the Daily Chart at 53.9635 and it remains neutral with no failure swings or negative or positive divergence. The Daily MACD too remains bullish as it trades above the signal line. 

The Stock Futures  have recorded a moderate decline in net Open Interest and also the NIFTY futures. However, the NIFTY PCR still leaves significant room on the upside, but the levels of 5144 would continue to act as immediate top for the Markets.

Today’s session would see the consolidation to continue. With the Markets expected to open above 200-DMA, it would be critically important for the Markets to remain in positive upward trajectory and sustain the levels above of 200-DMA to avoid any further weakness. For this, the intraday trajectory would be important. Even if the Markets consolidates, and maintains the levels above of 200-DMA. It would still be in the broad range of 5050-5144 and fresh up move shall occur only after the Markets moves past  the levels of 5144.

All and all, until the Markets moves past the levels of 5144, consolidating activities shall remain and volatility will refuse to go away. Further weakness would creep in only if the Markets significantly closes below 200-DMA otherwise, it is expected to trade in the broad range. It is advised to maintain liquidity and refrain from any aggressive positions on either side. Overall, continuation of cautious approach is advised for today.

Milan Vaishnav,
Consulting Technical Analyst,
+91-98250-16331


Thursday, June 14, 2012

Daily Market Trend Guide -- Thursday, June 14, 2012

MARKET TREND FOR TODAY                                                   June 14, 2012
The Markets staged a perfect consolidation yesterday on the Daily Charts as it ended the day flat with negligible gains after moving in either directions. The Markets opened moderately lower  and after trading in a range, gave its intraday low of 5095.45 in the later morning session. The Markets thereafter, as it has been doing in couple of previous sessions saw a sharp recovery. It recovered all of its losses and also went on to give the intraday high of 5144.90. However, it pared its gains later in the session and ended the day at 5121.45, posting a negligible gain of 5.55 points or 0.11%. It has formed a higher top and higher bottom on the Daily High Low Charts.

We expect the phase of consolidation to continue in the Markets ahead to two important external events. The Inflation numbers shall come in today and based on that, the Markets will have expectations on the RBI monetary policy to be announced on Monday in which there is consensus expectation of a rate cut. The Markets, until the announcements come in, are likely to remain in a range, and bit volatile.

The levels of 5148 and 5195 shall act as immediate resistance on the Charts and the levels of 5080 and 5068 shall act as supports.

The lead indicators continue to remain in place which indicates the underlying current to be intact. The RSI—Relative Strength Index on the Daily Chart is 61.0689 and it has reached its highest value in last 14-days which is bullish. It does not show any negative / positive divergence. The Daily MACD to remains bullish as it trades above its signal line. 

The NIFTY and Stocks futures have added in net open interest. The NIFTY PCR is at 1.48 and this still leaves a decent gap for continuation of up move.

Having said this, there are non-technical events that shall have impact on the Markets in the coming week. The Greece outcome, the inflation numbers coming in today and the RBI Monetary Policy announcements on Monday will have Markets reacting to it. However, the undercurrent, as mentioned earlier, still remains very much intact.

All  and all, the reading and conclusion remains very much the same like that of yesterday. The Markets are consolidating, but are trading above its critical support levels at Close. In such consolidating Markets, shorts should be strictly avoid unless there are explicit triggers. Longs too should not be aggressively taken. Highly selective approach with vigilant profit protection should be maintained. Overall, cautious optimism is advised for the day.

Milan Vaishnav,
Consulting Technical Analyst,
+91-98250-16331


Wednesday, June 13, 2012

Daily Market Trend Guide -- Wednesday, June 13, 2012

MARKET TREND FOR TODAY                                                June 13, 2012
After taking a breather for a day, the Markets resumed its up move as it ended the day yesterday with decent gains after a negative start as the dismal IIP growth numbers further fueled the hopes for a imminent rate cut. The Markets opened negative and gave intraday low of 5015.15 in the morning session. It traded in the range until the IIP numbers were announced and after the dismal number coming in, it converted itself into rising trajectory and went on to give the intraday high of 5128.90. It ended the day at 5115.90, posting a decent gain of 61.80 points or 1.22%. In the process, it has formed a similar top but lower bottom on the Daily High Low Charts. The volumes remained moderately higher than the previous session.

Today, expect the Markets to open flat and mildly  consolidate in the initial session, but speaking purely on technical grounds, the Markets have closed above their 200 and 50-DMA and these levels should technically act as supports in the event of consolidation.

The levels of 5140 and 5195 are immediate resistance levels on the Charts and the levels of 5085 and 5065 are expected to act as supports.

The lead indicators point towards continuing uptrend. The RSI—Relative Strength Index on the Daily Chart is 60.6688 and it has reached its highest value in last 14-days which is bullish. It does not show any negative divergence. The Daily MACD too remains bullish as it trades above its signal line.

Both NIFTY and stock futures have went on to add net Open Interest and thus, the F&O Data too supports possibility of continuation of uptrend. However, on the Candles, An Engulfing Bearish Line  has occurred. If the engulfing bullish pattern occurs during an uptrend (which appears to be the case with NIFTY), it may be a last engulfing top which indicates a top.  The test to see if this is the case is if the next candle closes below the top of the current (white) candle's real body. 

Given the above reading, it can be fairly concluded that the undercurrent certainly remains buoyant and the uptrend remains intact, but at the same time, there are fair amount of chances that the Markets mildly corrects or consolidates. In that case, the levels of 200-DMA shall act as support with the levels of 5125 acting as immediate resistance. 

All and all, the Markets  shall continue to remain volatile and likely to see intermittent profit taking bouts despite the trend remaining intact. So, while remaining selective in making new purchases, it is advised to continue to protect existing profits at higher levels. Shorts should strictly be avoided. Overall, cautious optimism is advised for the day.

Milan Vaishnav,
Consulting Technical Analyst,
+91-98250-16331


Tuesday, June 12, 2012

Daily Market Trend Guide -- Tuesday, June 12, 2012

MARKET TREND FOR TODAY                                                          June 12, 2012
The Markets ended the day on a modestly negative note as the technicals anyway pointed towards consolidation and also due to  S&P comments on possible downgrade as the Markets pared all of its morning gains. The Markets opened on a decently positive note as it gave its intraday high of 5124.45 in the morning trade itself. It continued to move sideways maintaining its opening gains but saw sudden paring of gains after the S&P’s comments. It not only pared all of its gains, but dipped into the negative to give the day’s low of 5040.70. It finally ended the day at 5054.10, with a modest loss of 14.25 points or 0.25%. Though the Markets have ended the day near the low point of the day, it has still formed a higher top and higher bottom on the Daily High Low Charts.

Even technically speaking, apart from reaction to the S&P’s comments, the consolidation phase in the Markets is likely to continue with the levels of 5125 acting as a immediate top. During the consolidation phase, the intraday trajectory are always important to avoid any further weakness but the levels of 200 and 50-DMA would continue to act as resistance at Close levels.

Today, the levels of 5075 and 5125 shall continue to act as resistance and the levels of 5010 and 4985 shall act as immediate supports.

The lead indicators continue to remain comfortably in place. The RSI—Relative Strength Index on the Daily Chart is 55.9919 and it is neutral as it shows no negative / positive divergence or failure swings. The  Daily MACD continues to trade above its signal line and is bullish. 

Further to this, the NIFTY and Stock Futures have continued to add in net Open Interest indication the creation of shorts. The NIFTY PCR stands at 1.44.

All and all, the consolidation phase shall continue and the sustainable up move shall occur only above the levels of 5125 and the levels of 200 and 50-DMA shall continue to pose resistance at Close. This shall keep the Markets volatile with some intermittent profit taking bouts. However, with the undercurrent still being intact, shorts and aggressive longs should be avoided and very selective purchases may be made while vigilantly protecting the profits. Overall, cautious outlook is advised for the day.

Milan Vaishnav,
Consulting Technical Analyst,
+91-98250-16331


Monday, June 11, 2012

Daily Market Trend Guide -- Monday, June 11, 2012

MARKET TREND FOR TODAY                                                        June 11, 2012
The Markets on Friday corrected on expected lines in the first half of the session but smartly recovered towards the end to finish the day as well as the week with the biggest gains since the Month of January. The Markets opened weak on weal global cues and continued to correct for the most part of the session. It traded with capped losses in the initial session and weakened further to give the day’s low of 4994.80. However, the Markets saw over 80-odd points recovery in the last hour and half of the trade as it not only recovered from its lows, but even went on to give the day’ high of 5084.45. The Markets finally ended the day at 5068.35, posting a gain of 18.70 points or 0.37%. The Markets have formed a higher top but lower bottom on the Daily Charts. It has ended the week with net gains of 226.75 points or 4.62%.

The Markets have consolidated intraday on Friday and today, since they have ended the day near the high point of the day, are expected to open on a positive note and continue with the up move at least in the initial session. The global cues are supportive of this, but it would be imperative for the Markets to end the day above the 200 and 50-DMA and thus intraday trajectory would be important.

The levels of 5095 and 5135 would act as resistance and the levels of 5060 and 5005 would act as immediate supports on the Charts.

The RSI—Relative Strength Index on the Daily Chart is 57.4547 and it has reached its highest value in last 14-days which is bullish. It does not show any negative or positive divergence. The Daily MACD continues to trade above its signal line and is therefore bullish. On the Weekly Chart, the RSI is 48.2571 and is neutral without showing any failure swings or  any divergence. The Weekly MACD however remains bearish as it trades below its signal line.

Having said this, it can be fairly concluded that the Markets are set to have a positive and strong start to the week but shall have to maintain a positive trajectory and maintain opening gains so as to maintain the levels above of 200 and 50-DMA to avoid any correction and remain in state of consolidation. However, at the same time, some amount of consolidation cannot be ruled out going further into the week.

All and all, with the positive start expected the Markets may hover in between 50 and 100-DMA on the charts. The up move should be smartly utilized to book profits on existing positions while new positions may be very selective taken in less aggressive manner  while vigilantly protecting profits at higher levels. Overall, positive approach is advised for the day. 

Milan Vaishnav,
Consulting Technical Analyst,
+91-98250-16331