Friday, April 13, 2012

Daily Market Trend Guide -- Friday, April 13, 2012

MARKET TREND FOR TODAY                                                                   April 13, 2012
Markets ended the day yesterday with gains though it traded in a capped range but kept the underlying strength intact. The Markets opened on a positive note as expected and traded in the upper band of 30-odd points. Post opening in the green, the Markets gave its intraday high of 5290.60 in the early afternoon trade and spent the rest of the session in a capped range. It pared some of its gains in the afternoon, but again recovered and finally managed to end the day at 5276.85, posting decent gain of 50 points or 0.96%. In the process, it has formed a higher top and higher bottom on the Daily High Low charts.

Today’s session would important for the Markets as we are expected to see a  decently positive opening in the Markets following strong technicals and favourable global cues. However, with the levels of opening expected, the Markets shall open near its one of the resistance levels and thus, it would be critically important for the Markets to see if it capitalizes on the strong opening and maintains its gains. For this, the intraday trajectory that it forms would continue to remain critically important.

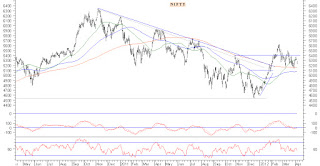
For today, the levels of 5338, which is 50-DMA for the Markets and also a pattern resistance in form of a falling trend line would act as resistance and the levels of 5240 and 5205 shall act as immediate supports.

The RSI—Relative Strength Index on the Daily Chart is 49.4903 and it is neutral as it shows no negative divergence or failure swings. The Daily MACD still is bearish as it trades below its signal line, but likely to see a positive crossover if Markets continues with its up move.

Having said this, both NIFTY and Stock Futures have continued to add Open Interest. The NIFTY PCR stands as 1.17 as against 1.14.

Overall, as mentioned in previous editions of Daily Market Trend Guide, there has been no structural breach on the Charts and overall, the Markets are likely to continue with their up move as under current remains buoyant. However, for a sustainable up move to occur, the Markets will have to move past 5350 – 5410 levels and until this happens, the Markets will remain in broad trading range and thus make see volatile and range bound movements.

All and all, with trend remaining intact, it is strongly advised to avoid shorts even if some profit booking is seen as Markets remains in a broad trading range. Stock specific purchases may be made and profits should be continued to be vigilantly protected. Overall, positive outlook is advised for today.

Milan Vaishnav,
Consulting Technical Analyst,
+91-98250-16331


Thursday, April 12, 2012

Daily Market Trend Guide -- Thursday, April 12, 2012

MARKET TREND FOR TODAY                                                         April 12, 2012
The Markets continued to see a volatile session yesterday and consolidated at close after recovering from day’s low amid great volatility and ended the day with moderate losses. The Markets opened with a minor gap down of around 1% and traded in a tight range on the lower side in the morning session. However, in the afternoon session, the Markets attempted a recovery and not only it recovered from its day’s lows but went on to trade in the green and gave its intraday high of 5263.65, recovering almost 70-odd points from its low. Volatility crept in again as it pared almost all of its gains. It recovered half of it again but finally ended the day at 5226.85, posting a moderate loss of 16.75 points or 0.32%. In the process, it has formed a higher top but lower bottom on the Daily High Low charts.

Today, expect the Markets to continue to consolidate as it has been doing in the last couple of sessions. It is expected to open flat and look for direction and would continue to heavily depend upon the intraday trajectory it forms and because of this, it is likely to also continue to remain volatile.

For today, the levels of 5265 and 5325 are likely to act as immediate resistance and the levels of 5202 and 5146 shall act as major support levels in form of its 200DMA.

As evident from the charts above, the Markets have continue to remain in a broad trading range with no breakout on either side and thus, is expected to continue to consolidate amid volatility.

The RSI—Relative Strength Index on the Daily Chart is 45.7470 and is neutral as it shows no negative divergence or failure swings. The Daily MACD trades below its signal line.

It is important to note that NIFTY’s Open Interest is at its all time low levels and this reduces the fears of any negative breakout on the Charts. Also, after shedding Open Interest in last seven consecutive sessions, yesterday, it has seen a moderate addition in Open Interest. This has accompanied with the Stock Futures too adding in total Open Interest. Signifies mild level of buying at these levels.

All and all, this points out that the Markets shall continue to consolidate and shall do that with upward bias. Even in case of any weakness, it shall be short lived with the Markets not expected to breach any major support levels. Volatility and stock specific action is likely to continue. Markets shall also react a bit to the IIP numbers expected. Overall, the trend remains intact and thus, it is strongly advised to avoid any shorts and aggressive positions on either side. Selective purchases may be made. Overall, cautious optimism is advised for today.

Milan Vaishnav,
Consulting Technical Analyst,
+91-98250-16331


Wednesday, April 11, 2012

Daily Market Trend Guide -- Wednesday, April 11, 2012

MARKET TREND FOR TODAY                                                  April 11, 2012
The Markets had an extremely range bound session yesterday as it moved in a very narrow band in either direction and ultimately ended the day with modest gains. The Markets opened moderately negative  but soon moved into positive zone as it gave its intraday high of 5255.80. It however, pared its gains as it gradually traded flat and further into negative territory by afternoon trade to give its intraday low of 5211.85. It saw a v-shaped recovery towards the end of the session, went almost to its intraday high levels and finally ended the day at 5243.60, posting a moderate gain of 9.20 points or 0.18%. It has went on to form a lower top and lower bottom on the Daily High Low Charts.

Today’s analysis would remain more or less similar to that of yesterday and we will continue to see the Markets consolidating without any significant breakdown and we may continue to see the Markets trading volatile and range bound.

Expect the Markets to open on a moderately negative note and look for directions. It will continue to heavily depend upon the intraday trajectory for today’s trend and is likely to see lower volumes as it continues to consolidate. The levels of 5290 and 5330 shall act as immediate resistance on the Charts and the levels of 5205 and 5180 shall act as immediate supports.

The RSI—Relative Strength Index on the Daily Chart is 43.8265 and is neutral as it shows no negative divergence or failure swings. The Daily MACD has turned bearish as it has reported a negative crossover and now trades below its signal line.

Having said this, inspite of continuing weakness, it is important to note that here is no negative breakdown or any breach of pattern on the Daily Charts. The Markets continue to remain in a broad trading range with the major support coming in in form of its 200-DMA which is 5146. So even if the Markets drifts to that levels, there won’t be any breach on the Charts. The Markets today are likely to consolidate and will see trading in a range and some amount of volatility ingrained in it.

All and all, with the consolidation likely to continue, it is advised to remain cautious and with no negative breach on the Charts shorts should be avoided. On the other hand, aggressive longs positions too should be avoided and profits be protected at higher levels. Any dip should be used in making selective purchases as stock specific activity would continue. Overall, moderately positive approach with caution is advised for today.

Milan Vaishnav,
Consulting Technical Analyst,
+91-98250-16331


Tuesday, April 10, 2012

Daily Market Trend Guide -- Tuesday, April 10, 2012

MARKET TREND FOR TODAY                                                                 April 10, 2012
The Markets had an disappointing session yesterday with it ended with losses after opening in the red and spending the entire session in the falling trajectory. The Markets opened on a negative note following global weakness and remained so in the downward falling trajectory for the entire session. The Markets traded in a narrow band of 30-odd points post negative opening. It slipped further into the red as it gave its intraday low of 5228. It finally ended the day at 5234.40 posting a cut of 88.50 points or 1.66%. In the process, it has formed a lower top and lower bottom on the Daily High Low charts.
 
Today, we are likely to see a modestly positive opening in the Markets and we might see some respite from the weakness that we saw yesterday. The Markets are expected to open on a modestly positive note and look for directions heavily depending upon the intraday trajectory it forms and maintains.

For today, the levels of  5275 and 5325 are immediate resistance levels and the levels of 5100 and 5165 are immediate supports on the Charts.

All lead indicators continue to remain in place. The RSI—Relative Strength Index on the Daily Charts is 46.1787 and it is neutral as it shows no negative divergence or failure swings. The Daily MACD continues to remain bullish as it trades above its signal line.

Having said this, it is important to note that NIFTY has shed Open Interest in sixth straight session of  trading while Stock Futures continuing to add Open Interest in similar fashion. Further important to note is the fact that even with yesterday’s fall, there is no negative breach or breakdown on Charts and the Markets continue to remain in a broad trading range with 200-DMA 5146 continuing to act as major support.
Markets will not see any significant up move until it moves past 5350-5420 resistance zone, in the similar fashion, it will not see any significant breakdown until it breaches its 200-DMA on the downside. It is likely to remain in a broad trading range until it takes a definite direction with bias on the upside. Until this time, it is likely to trade in a range and also bit volatile.

All and all, with the Markets remaining in a range, highly stock specific activities would be seen. Stock specific purchases may be done with vigilant profit protection while avoiding aggressive position on either side. Overall, cautious outlook is advised for today.

Milan Vaishnav,
Consulting Technical Analyst,
+91-98250-16331