Wednesday, December 21, 2011

Daily Market Trend Guide -- Wednesday, December 21, 2011


DAILY MARKET TREND GUIDE                                               December 21, 2011

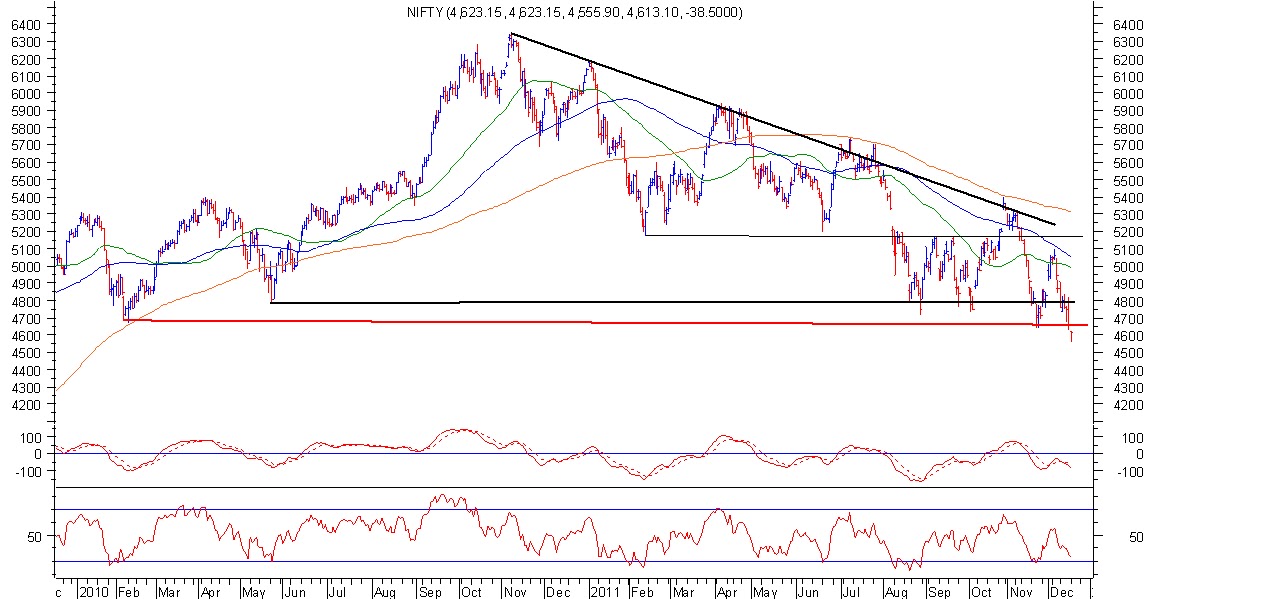
The Markets traded in line with the analysis carried out yesterday for the entire session, except that it suddenly fizzled out in the last 45 minutes of the trade to end yet another day of losses as it ended the day at 4544.20 down by 68.90 points or 1.49%. The Markets recovered some 50-odd points from its day’s low to trade flat but pared some 70-odd points from that levels to end the day with losses. In our yesterday’s edition, we had mentioned that given the technical indicators, the levels of 4555  would act as immediate support. That support held good until end of the session where it was temporarily broken. In the process, the Markets have formed a higher top and lower bottom as evident from the below chart. Thus, in the last nine sessions, NIFTY has shed 518.40 points or 10.70%.

Today, we can expect a long overdue pullback in the Markets. The European Markets have ended strong followed by strong consumer sentiment index in Germany and successful auction of Spanish bonds. The US too has rallied overnight and the Asian Markets are trading strong.

The Indian Markets too, which are nearly OVERSOLD and one of the worst performer among its peers is expected to give a gap up opening. It would be extremely important for the Markets to remain in positive rising trajectory post opening in order to capitalize on the positive opening. The levels of 4675 shall act as immediate resistance, the support (indicated with red line on the charts) which it broke. On the lower side, theoretically speaking, would be the levels of 4555.

The NIFTY added Open Interest yesterday, the OVERSOLD stock continued to get further OVERSOLD while adding Open Interest so the pullback that we would see would be imminent anyway, which would be supported by the buoyant global markets.

We refer our Monday’s edition of Daily Market Trend Guide wherein we had mentioned the Weekly Chart of the NIFTY and had mentioned that baring weakness for a day or two, the overall Week should not be that bad for the Markets and with today’s opening, we would neutralize this week losses, leaving the rest to the Markets to sustain. Also, as mentioned yesterday, even though the Markets continue to move further down, it has a potential for a sharp pullback, to the tune of 150-200 points, still remaining in overall downtrend and overall falling channel.

Thus, watching the intraday trajectory for the Markets which would be critically important, positive outlook is advised for today.

Milan Vaishnav,
Consulting Technical Analyst,
+91-98250-16331


Tuesday, December 20, 2011

Daily Market Trend Guide -- Tuesday, December 20, 2011

MARKET TREND FOR TODAY                                              December 20, 2011

The Markets had an extremely volatile session yesterday as it remained in a 35-odd point range for the most part of the session, but swinged wildly in the either direction. However, the Markets did not lose beyond the opening losses as it resisted to weakness and saw some short covering towards the end to end the day at 4613.10, posting a loss of 35.50 Points or 0.83%. With this, the Markets have lost 449.50 points or 9.21% in last eight sessions. In this process, the Markets have formed a lower top and lower bottom on the Daily High Low charts.

As evident from the above chart, the NIFTY has broken down the support of 4692 and have formed a distinct lower top and lower bottom on the Daily High Low Charts. However, the overall analysis of the expected trend today would remain more or less with the analysis carried out for yesterday. That means, even if some weakness persists due to this weak pattern, it would be resisted by other technical factors.

Expect the Markets to open on a flat note and look for directions and the intraday trajectory that it forms would be critically important to decide the trend for today. The levels of 4692 and 4735 shall act as resistance and yesterday’s intraday low of 4555 shall act as immediate support followed by levels of 4530.The contradictory reading of the NIFTY Futures shedding Open Interest and the Stock futures adding big open interest continues with other technical indicators pointing towards  resistance to the downside.

The RSI—Relative Strength Index is 33.2573 and it has reached its lowest value in last 14-days which is bearish. The Daily MACD continues to trade below its signal line. However, on the Candles, A hammer occurred (a hammer has a long lower shadow and closes near the high).  Hammers must appear after a significant decline or when prices are oversold (which appears to be the case with NIFTY) to be valid.  When this occurs, it usually indicates the formation of a support level and is thus considered a bullish pattern.

Further, A hanging man occurred (a hanging man has a very long lower shadow and a small real body).  This pattern can be bullish or bearish, depending on the trend.  If it occurs during an uptrend it is called a hanging man line and signifies a reversal top.  If it occurs during a downtrend (which appears to be the case with NIFTY) it is called a bullish hammer.

Also long lower shadow occurred on Candles.  This is typically a bullish signal (particularly when it occurs near a low price level, at a support level, or when the security is oversold).

With the RSI very near to its OVERSOLD zone and the candles showing a potential bottom formation for the short term, any weakness is likely to be resisted. The NIFTY PCR is 0.91.

Overall, yesterday’s outlook for the Markets is reiterated and it is advised to continue to maintain liquidity  while avoiding aggressive positions on either side, especially on the short side. With the Markets losing almost 10% straight, there are chances of a pullback, or at least resistance on the downside even while remaining in the overall falling channel. Caution with mild optimism is advised for today.

Milan Vaishnav,
Consulting Technical Analyst,
+91-98250-16331


Monday, December 19, 2011

Daily Market Trend Guide -- Monday, December 19, 2011

MARKET TREND FOR TODAY                                                  December 19, 2011


The Markets took an totally unexpected turn on Friday in the last hour and half of trade as it came off over 150-off points from its day’s low as it reported a low of 4628.20, and ended the day at 4651.60 posting a net loss of  94.75 points or 2 % taking it to 52-week low as well as close. The Markets was expected to react to the RBI Rate announcements and it kept the key rates expectedly unchanged, but the same remained a non-event on Friday. In the process the Markets have formed a higher top and higher bottom on the Daily High Low Chart. With this the Markets have ended the Week with net loss of 215.10 points or 4.47%.  In last seven sessions, the Markets have lost 411 points or 8.38%.


Yesterday’s fall came in absolutely unexpected as the RBI expectedly did not raise rates, the Rupee recovered from the all time lows, the advance tax numbers of the leading companies are not bad at all, the crude price has come down, and thus the Markets had no apparent reason for a foul cry. The Macro Economic Concerns are definitely there, but then the valuation of the Markets stands discounted at these levels with the PE earnings of 11-11.5 times of 2013 forward earnings.


It is important to note that this fall in the last hour of the trade is attributed to one Big Operator on behalf of two to three FIIs who went on a short selling spree to the extent of 250-300  Crores each. The amount is not big enough that could warrant such a fall, but the absence of buying on the other hand and total lack of depth led to the gravity of it. This was further fueled by margin calls of 5-leading brokers  in the last hour of the trade leading to this quantum of the fall. It is further important to note that the NIFTY and the Stock futures have reported net addition of Open Interest across the board.


Again, while taking the note of the above mentioned fact,  the NIFTY has broken its all important support levels of 4630-4650 and has turned bearish on charts. Also, with the lead indicators are yet to get OVERSOLD and thus has got a fair chance of weakness continuing. However, some indicators on the Daily and Weekly Chart shows that the Markets still has some chance of preventing itself from giving a negative breakdown on the charts and has a chance of a technical pullback, even though it continues to keep itself in the current downward trajectory.


For today, the levels of 4735 and 4795 shall act as resistance the levels of 4605 and 4570 shall act as supports. The RSI—Relative Strength Index on the Daily Chart is 34.8459 and it has reached its lowest value in last 14-days which is bearish. The Daily MACD continues to trade below its signal line. However, on the Candles, An Engulfing Bearish Pattern  has occurred. When this occurs during a downtrend, which is clearly the case with NIFTY, it may be a Last Engulfing Pattern which indicates a BULLISH REVERSAL. This needs a confirmation today.


Further on the Weekly Charts, the RSI is 39.0259. The NIFTY has set a new 14-week low but the RSI has not. This is a BULLISH DIVERGENCE.


The bottom line is that even if the weakness persists for a day or two, the Markets STILL HAS a chance of sharp pullback, even though it continues to keep itself in the falling channel. It is advised to use this as a opportunity of making selective purchases and in even of weakness, aggressive shorts should be avoided as any further weakness shall take the Markets towards getting oversold. Overall, a very selective and light stance / participation in the Markets is advised while maintaining liquidity. A cautious approach with mild optimism is advised for today.


Milan Vaishnav,
Consulting Technical Analyst,
+91-98250-16331


Thursday, December 15, 2011

Daily Market Trend Guide -- Thursday, December 15, 2011 (Published in the morning before the Markets opened)

MARKET TREND FOR TODAY                                                                    December 15, 2011
The second half of the session yesterday turned out to be disappointing again as the Markets gave up its intraday recovery to end the session yet again with losses. It ended the day at 4763.25, down by 37.35 points or 0.78% and in the process have still managed to form a higher top and higher bottom as shown in the chart below.

Today’s session is expected to be a critical session for the Markets. The Markets are expected to open weak once again are today expected to lend some stability if the technicals are to be believed as the opening is expected to be around its long term trend support in the range of 4700-4710, which is the red line drawn in the above chart. This level is expected to act as a critical support for the Markets.

Having said this, the NIFTY has lost 299.35 points or 6.03%  in last five sessions and with today’s weak opening expected, it would have lost around 350-odd points. Also, we would like to point out that the NIFTY has been constantly adding Open Interest since last three session which has resulted into creation of shorts in the system. This is evident from the fact that the NIFTY Premiums on the futures have reduced from 25-odd points 3-4 days back to almost at par (Zero) yesterday.

The RSI—Relative Strength Index on the Daily Chart is 39.8571 and is neutral as no negative divergence or failure swing is seen. The MACD is bearish as it is trading below its signal line.
There is no doubt that the negative sentiments, both domestic and external are weighing heavy on the Markets. But given the RSI at 39, and the negative opening around the support levels expected today and with having the Markets losing around 350-odd points straight, it is unlikely that the Markets will break the support line (the red line drawn on the Chart) easily without a technical pullback.

The weak opening today should be used to try and average any existing long position with a strict stoploss. There are bright chances that the Markets see a technical pullback which it saw a day before, and the only factor that can resist this is the RBI announcements tomorrow. Thus, caution is likely to prevail, but the trend is expected to be clearer after tomorrow, with a bias for a sharp technical pullback. Continuance of cautious approach is advised without any aggressive positions.


Wednesday, December 14, 2011

Daily Market Trend Guide -- Wednesday, December 14, 2011 (Published in the morning before the Markets opened)

MARKET TREND FOR TODAY                                                        December 14, 2011

The Markets had a volatile session yesterday wherein it saw sharp intraday movements but saw equally sharp short covering in the last 45 minutes of the trade as it snapped its 3-day losing streak to end the day with modest gains. The Markets on a modestly negative not but after briefly trading into red, it managed to move into positive territory. However, as categorically mentioned in our yesterday’s edition, the levels of 4780, continued to pose as resistance for the major part of the session. The Markets then pared all of its gains to give the day’s low of4728.50. But again, as mentioned in our yesterday’s edition, the Markets saw equally sharp short covering in the last 45-minutes of the trade as it recovered some 95-odd points from its lows to give day’s high of 4824.70. It finally ended the day at 4800.60, posting a rise of 36 points or 0.76%, but still formed a lower top and lower bottom on the Daily High Low Charts.

Today’s analysis remains more or less same and similar like that of yesterday. For today, expect the Markets to open moderately lower and look for directions and the intraday trajectory would continue to remain extremely critical to decide today’s trend. The Markets are expected to open lower than 4780, thus, the levels of 4780 and 4855 shall act as resistance and the levels of 4720 and 4680 are technical supports on the Charts.  Though the Markets ended the day near the high point of the day and technically it should continue with the up move, but global volatility will weigh in and is all likely to set a modestly lower opening.
 
The lead indicators are showing little weakness today. RSI—Relative Strength Index on the Daily Chart is 41.6017 and is neutral as it shows no negative divergence or failure swings. The MACD on the Daily Chart has reported a negative cross over as it now trades below its signal line. This is a little weakness on the charts.

Having said this, the contradictory reading continues. The NIFTY Futures have indicated decrease in Open Interest by around 3%, but on the other hand, majority of the NIFTY Components have shown addition in Open Interest. This shows that while shorts were covered in NIFTY Futures, some longs have been selectively added in the Stock Futures. However, NIFTY short covering will have to be replaced with longs for the recovery that we saw yesterday to continue.

In the given uncertain and contradictory reading, we would like to repeat our advice of refraining in taking aggressive positions on either side, which maintaining enough liquidity to hold on to existing positions. The Markets are likely to continue to remain volatile and such sharp technical pullbacks cannot be ruled out. Continuance of cautious outlook is advised for today.

Milan Vaishnav,
Consulting Technical Analyst,
www.MyMoneyPlant.co.in    
http://milan-vaishnav.blogspot.com
+91-98250-16331
milanvaishnav@mymoneyplant.co.in
milanvaishnav@yahoo.com